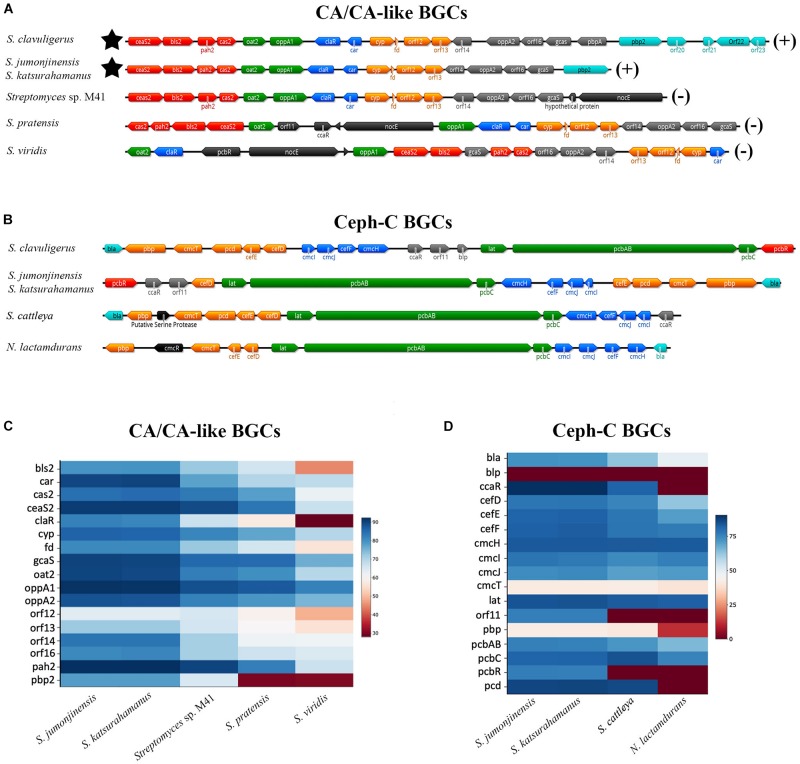
FIGURE 3.
Organization of CA/CA-like (A) and Ceph-C (B) BGCs in select CA-producing/non-producing Streptomyces species. The CA non-producers Saccharomonospora viridis (A,C) and Nocardia (or Amycolatopsis) lactamdurans (B,D) were also included for comparison as both are phylogenetically distinct from the Streptomyces. (A,B) The architecture of respective BGCs from the described organisms showing their gene content and relative organization. Genes are color-coded based on known or predicted transcriptional units. (A) The star symbol represents the location of the Ceph-C BGC (if present) and the CA production status (±) of each organism is indicated on the right. (B) All species included are Ceph-C and CA producers except for S. cattleya and N. lactamdurans, which only produce the former. (C,D) Relative identities of protein products from the CA/CA-like (C) and Ceph-C (D) BGCs of described organisms as compared to corresponding homologs from S. clavuligerus. The legend on the right shows colors indicating percent identities between respective gene products.

