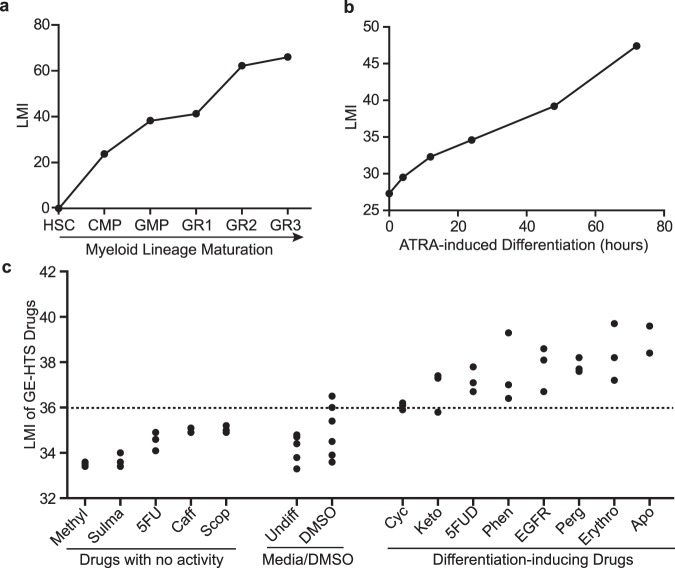
Figure 2.
LMI detects changes in differentiation status in known examples of differentiation. (a) LMIs of distinct human myeloid cells along the developmental stages from the most immature stem cells to the mature granulocytes. (b) LMI analysis of APL leukemia (NB4 cells) treated with ATRA for 72 hours. (c) LMIs for the drugs from GE-HTS project. The Student’s t test for each drug treatment compared to DMSO controls is shown in Supplementary Table S1. The dashed line indicates the p value cut off at 0.05.

