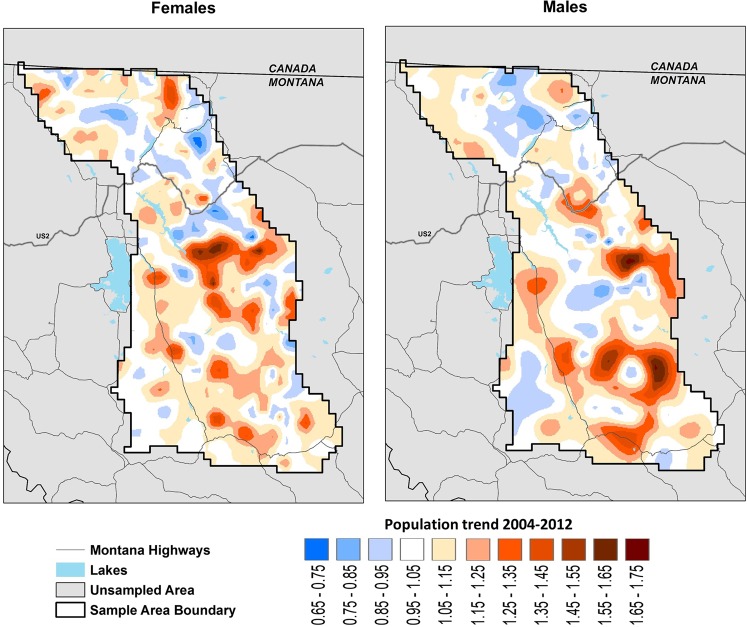
Figure 3.
Annual local rates of change in grizzly bear population density within the Northern Continental Divide Ecosystem in northwestern Montana 2004–2012. Population trend was calculated as the annual geometric rate of change in grizzly bear density (D) between 2 years. Rate of population change was calculated for each 16 km2 state space pixel defined by our spatial capture-recapture model. The estimate area was smaller for 2004 than in subsequent years because few bear rubs were found along the eastern edge of the study area that year. Local density should only be inferred for the area sampled. Growth rates > 1.0 denote areas of population growth; rates < 1.0 denote areas of population decline.

