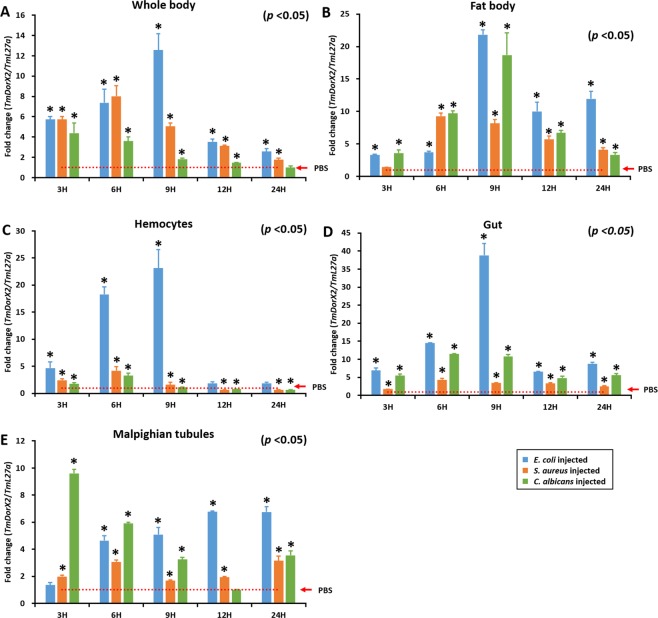
Figure 4.
Temporal expression profiles of TmDorX2 in response to E. coli, S. aureus, and C. albicans infection in the whole body (A), fat body (B), hemocytes (C), gut (D), and Malpighian tubules (E) of T. molitor young larvae (10th to 12th instar larvae), examined by qRT-PCR at 3, 6, 9, 12, at 24 h post-infection. TmDorX2 expression levels were normalized to their levels in phosphate buffered saline (PBS)-injected controls. The T. molitor 60 S ribosomal protein L27a (TmL27a) was used as an internal control. Vertical bars indicate mean ± SE (n = 20). ‘*’ Indicates significant differences (p < 0.05).

