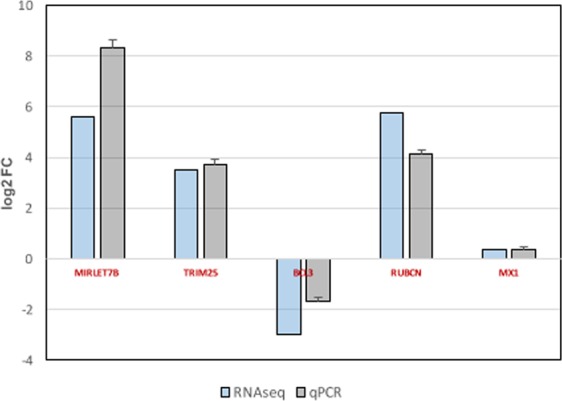
Figure 4.

Comparison of RNA-seq and qRT-PCR data of A549 cells treated with pinometostat. For qRT-PCR analysis, A549 cells were plated alone or with pinometostat (1 μM,48 h). RNA was extracted and used for qPCR detection of MIRLET7B, TRIM25, BCL3, and RUBICON genes and MX1 as control. Comparison of the qRT-PCR and RNA-seq data is shown. The differences between untreated and treated cells were analyzed and are represented as log2 Fold Change. Three technical replicates of three independent experiments were performed.
