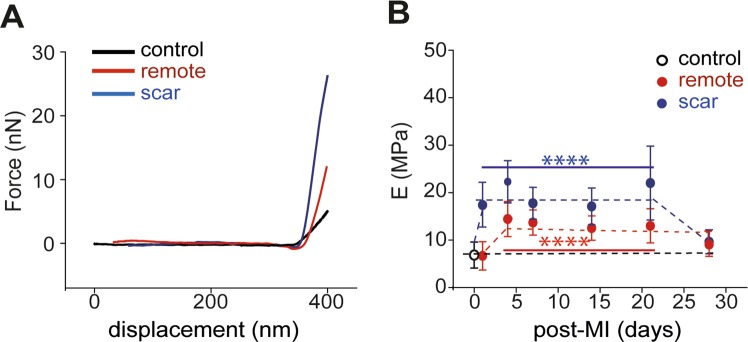
Figure 5.
Bio-mechanical characteristics of control (open circle) vs. remote and scar regions. (filled circle) (A) Representative force (F) vs. displacement (d) retraction curves recorded on control, scar and remote regions of mice heart tissue. The differences in the slopes of F-d curves indicate different elastic properties (stiffness) of the heart tissue. (B) Time dependent biomechanics modification of the E-Modulus (E) in control and remote vs. infarct scar. In the inflammatory phase (7–21 days post-MI) infarct scar undergoes a maximum tension compared to the remote region and it returns at its initial values at 28 days post-MI (****p < 0.0001).

