Fig. 7.
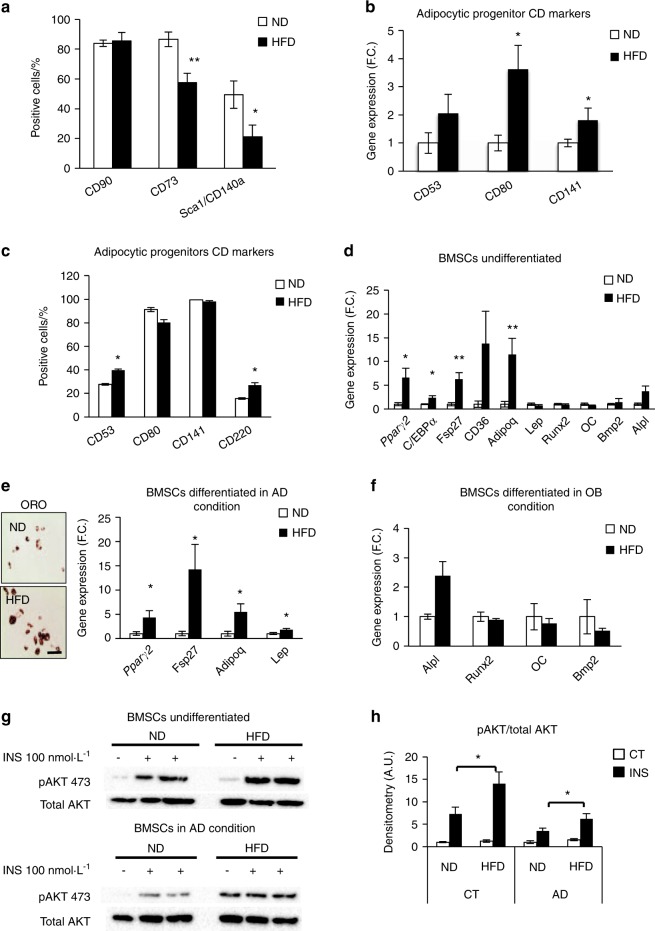
In vivo changes in the bone marrow microenvironment induced by a high-fat diet (HFD) regulate adipocyte and osteoblast progenitors. a Screening of stem cell marker expression measured by flow cytometry in primary BMSCs isolated from mice fed with an ND or HFD for 12 weeks (n = 5 per group). b Gene expression of adipocytic progenitor CD markers (CD53, CD80, and CD141); and c flow cytometry of adipocytic CD markers (CD53, CD80, CD141, and CD220) in BMSCs obtained from ND and HFD mice (n = 6 per group). Data are presented as the mean of the fold change (F.C.) normalized to ND BMSC gene expression ± SEM; *P < 0.05: ND vs HFD, two-tailed unpaired Student’s t test. d Gene expression profile of adipocytic genes (Pparγ2, C/ebpα, Fsp27, CD36, Adipoq, and Lep) and osteoblastic genes (Runx2, OC, Bmp2, and Alpl) presented as the fold change in BMSCs of ND and HFD mice (n = 6 per group); e representative pictures of AD differentiation (day 10) visualized with Oil Red O staining in BMSCs from ND and HFD mice, (scale bar 100 μm) and gene expression profile of adipocytic genes (Pparγ2, Fsp27, Adipoq, and Lep) presented as the fold change in AD differentiated BMSCs of ND and HFD mice (n = 6 per group); f gene expression profile of osteoblastic genes (Alpl, Runx2, OC, and Bmp2) presented as the fold change in OB differentiated BMSCs of ND and HFD mice (n = 6 per group); g representative western blot of insulin-stimulated (100 nmol·L–1, 15 min) phosphorylation of AKT (p-S473AKT) and total AKT in undifferentiated and AD differentiated BMSCs isolated from ND and HFD mice (n = 5–6 per group); h densitometry of pAKT/total AKT in undifferentiated and AD differentiated BMSCs isolated from ND and HFD mice. Data are presented as the mean ± SEM; *P < 0.05, **P < 0.01 compared with ND, two-tailed unpaired Student’s t test

