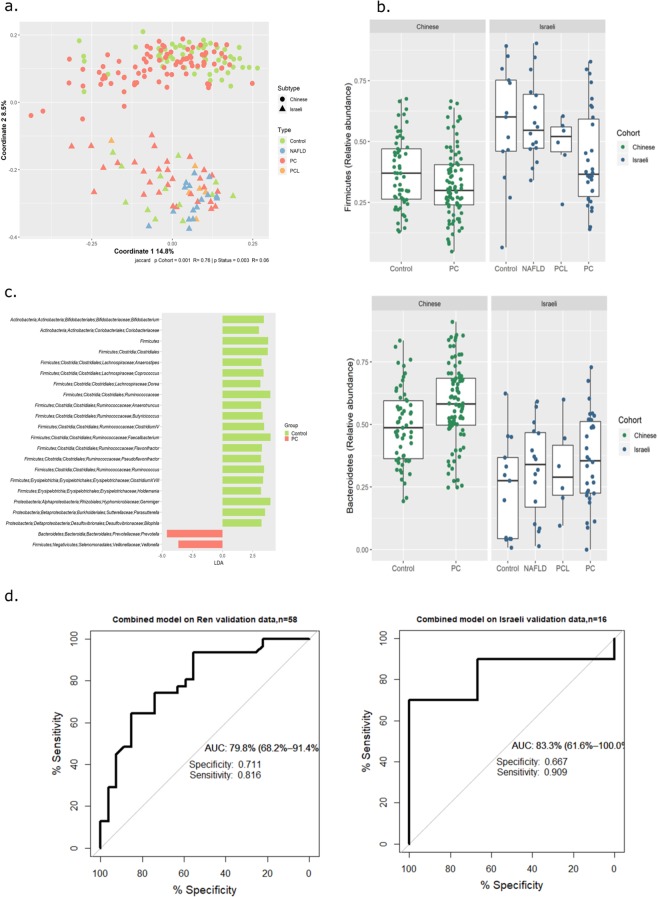
Figure 5.
Both origin and disease effects are evident in an integrative analysis of two cohorts. Data from a Chinese cohort10 was integrated with our own to form a merged dataset for analysis. (a) PCoA of Jaccard distance matrix. (b) Boxplots of key phyla across cohort and type. (c) LEfSe analysis identifies disease discriminating taxa in the integrated dataset. (d) ROC of a random forest model built on the features identified in (c). In the boxplots, lines indicate median relative abundances, boxes denote 3rd and 1st quantile, whiskers denote ± 1.5*IQR, and outliers are shown as dots.

