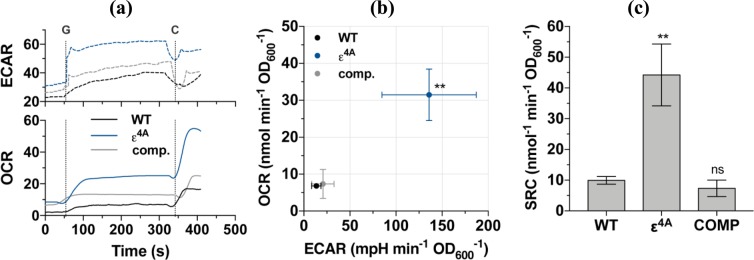
Figure 3.
Oxygen consumption and extracellular flux analysis of mutant ε4A. (a) Raw trace schematic of experimental setup. Respiration was initiated with 0.2% glucose and subsequently uncoupled with 10 µM CCCP at points “G” and “C”, respectively. (b) Baseline-subtracted OCR vs ECAR phenograms of M. smegmatis strains after glucose-stimulated respiration. (c) The spare respiratory capacity (SRC, calculated as [OCRCCCP - OCRglucose]) of M. smegmatis strains.

