Figure 6.
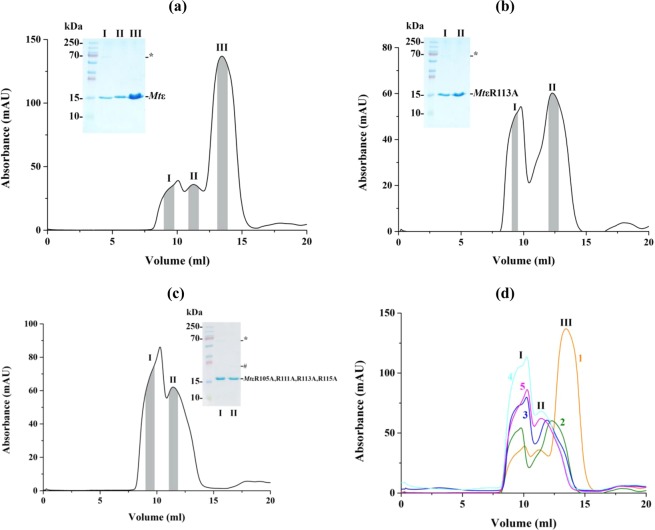
Recombinant protein purification of Mtε and its mutants. (a) Three peaks were detected at 9.5, 11.5 and 13.8 ml in the SEC elution profile of Mtε. A higher oligomer band (*; around 70 kDa) and a monomer at 15 kDa were observed in the SDS gel in the inset. (b) Elution profile of MtR113A revealed two peaks at 9.5 and 12.5 ml. Grey area under each peak outlines the range of eluates collected and applied on lanes I and II of the respective gel. (c) In comparison, the elution diagram of the mutant MtεR105A,R111A,R113A,R115A showed a major peak at 9.5 ml and a second peak which eluted earlier at 11.5 ml. The respective peak samples were applied onto the lanes I and II of the SDS-gel presented as an inset. * and # indicate a higher- and lower oligomer. (d) Overlay of SEC chromatograms for WT Mtε and the mutants, where (1) WT, (2) MtεR113A, (3) MtεR113A,R115A, (4) MtεR111A,R113A,R115A, and (5) MtεR105A,R111A,R113A,R115A. Each of the three peaks is associated with one of the following states: higher oligomer (I), lower oligomer (II), and monomeric (III).

