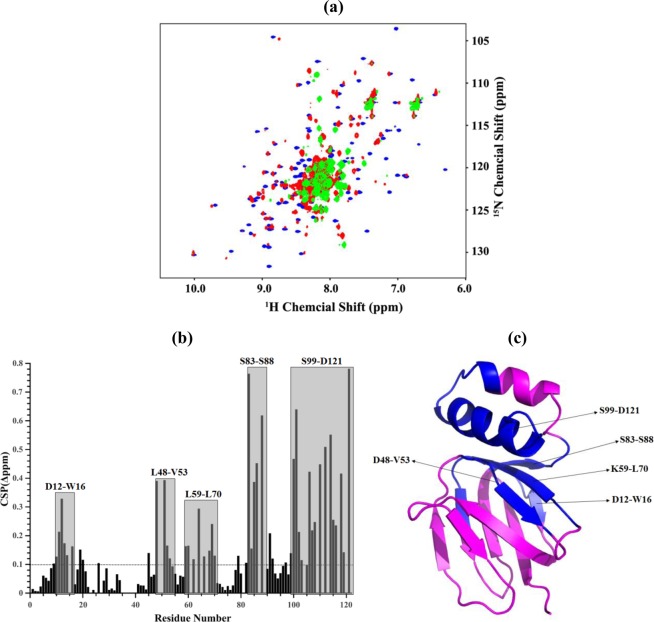
Figure 7.
NMR studies of Mtε and its mutants. (a) Comparison of overlaid HSQC spectra for Mtε (blue), MtεR113A (red), and MtεR105A,R111A,R113A,R115A (green). (b) Weighted Chemical Shift Perturbations (CSPs) for the 15N and 1H resonance between Mtε and MtεR113A; regions with residues showing CSP above the average weighted CSP value are highlighted with grey colour and labelled as one-letter code. The weighted CSPs between Mtε and MtεR113A for backbone 15N and 1HN were calculated by the formula Δδ = [(ΔN/5)2+(ΔHN)2]0.5. The average CSP weighted value was displayed by dashed line. (c) Ribbon representation of Mtε showing the regions and residues with significantly changed chemical shift perturbation values above average (blue).

