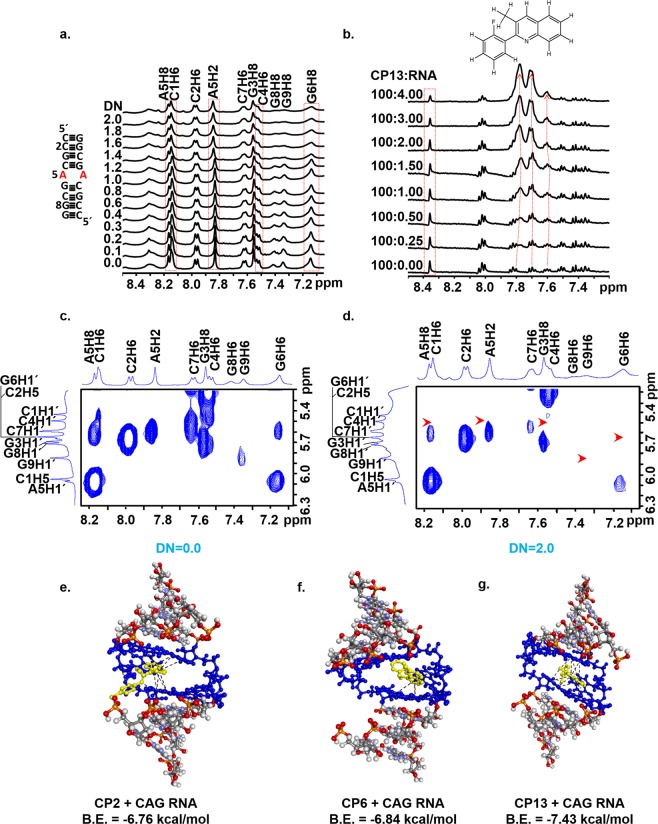
Figure 5.
Structural insight into the interaction of 5′r(CCGCAGCGG)3′ with CP13 using NMR spectroscopy. One dimensional proton spectra of RNA as a function of increasing concentration of CP13 showing (a) base region (b) NMR titration of CP13 with increasing concentration of RNA (c–d) Two dimensional NMR spectroscopy of 5′r(CCGCAGCGG)3′ with CP13 at 298 K, at D/N ratios of (c) D/N = 0.0 (d) D/N = 2.0 (e–f) Docked structure of RNA with compounds (e) CP2 (f) CP6 (g) CP13

