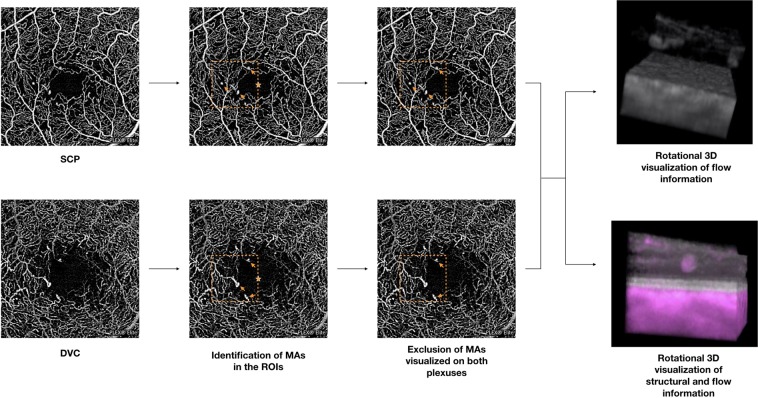
Figure 1.
Representation of the algorithm used to process the images. The images of the superficial capillary plexus (SCP) and deep vascular complex (DVC) were graded for the presence of microaneurysms (MAs – indicated with arrows) in a 1-mm square region of interest (orange square) that was temporal and tangential to the foveal center (orange star). Those MAs visualized on both plexuses were included once. The OCTA volume scans were imported in ImageJ and elaborated (please see the “Methods” section for further details) in order to obtain the rotational 3D visualization of each MA, in which OCTA-based flow information is displayed as gray. Moreover, a second 3D visualization in which structural OCT and OCTA information had different colors (gray and magenta for structural and flow information, respectively) was used to topographically correlate MAs with retinal layers.

