Figure 2.
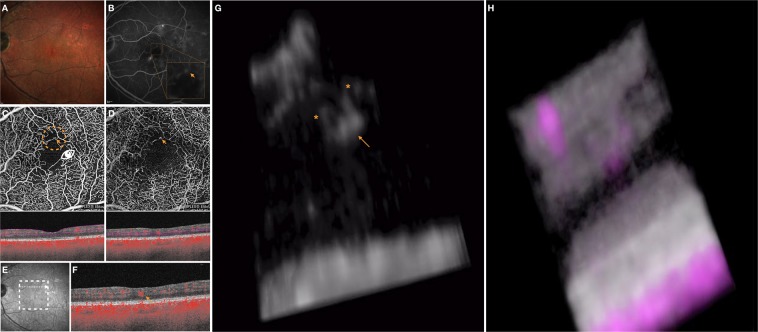
Multimodal imaging of the LE of a 61-year-old man diagnosed with non-proliferative diabetic retinopathy. The 3D OCTA visualization offers further details on the highlighted microaneurysm. (A) Multicolor image illustrates a few retinal hemorrhages and microaneurysms within the macula. (B) Fluorescein angiography (FA) shows several areas of pinpoint hyperfluorescence corresponding to the microaneurysms and some areas of blocked fluorescence due to the retinal hemorrhages. The orange arrow in the FA image indicates a MA which is evident on both the superficial capillary plexus (SCP) (D) and deep vascular complex (DVC) (E) 2D en face optical coherence tomography angiography (OCTA) images. Slabs used to visualize the en face OCTA images are shown. The white arrow in the near-infrared reflectance image (E) illustrates the location and direction of the OCTA B-scan (F) which shows the transversal visualization of the selected MA within the retinal layers. The 3D OCTA visualization (image (G) is the frame obtained by visualizing the circular region of interest highlighted on image (C) and visualized from the angle marked with the white eye) displayed the selected MA (highlighted with the orange arrow) and two vessels (highlighted with the orange asterisks) associated. The 3D visualization of combined OCTA (magenta) and structural OCT (gray) information (H) demonstrates that the MA is mainly contained in the INL and OPL.

