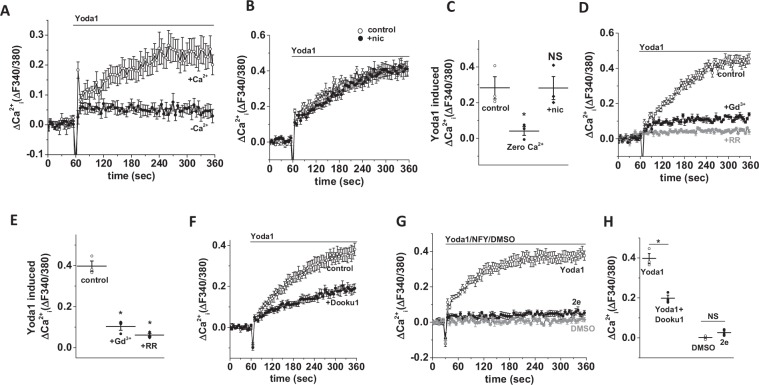
Figure 2.
Characteristics of Yoda1-induced Ca2+ influx in INS-1 cells. (A,B) Example data showing the effect of zero extracellular Ca2+ (A) and nicardipine (B) pre-treatment on the Yoda1-mediated Ca2+ response in INS-1 cells. (C) Mean data obtained from 3 independent experiments of the types shown in (A,B). (D) Example data showing the effect of gadolinium (Gd3+) and ruthenium red (RR) pre-treatment on Yoda1-mediated Ca2+ response in INS-1 cells. E) Mean data obtained from 3 independent experiments of the types shown in (D). (F) Example data showing the effect of Dooku1 pre-treatment on the Yoda1-mediated Ca2+ response in INS-1 cells. (G) Example data showing the effect of Yoda1, a non-functional Yoda1 analogue (2e) and DMSO (control) on Ca2+ influx in INS-1 cells. (H) Mean data obtained from 3 independent experiments of the types shown in (F,G). Data are expressed as mean ± sem; * denotes p < 0.05 vs control.

