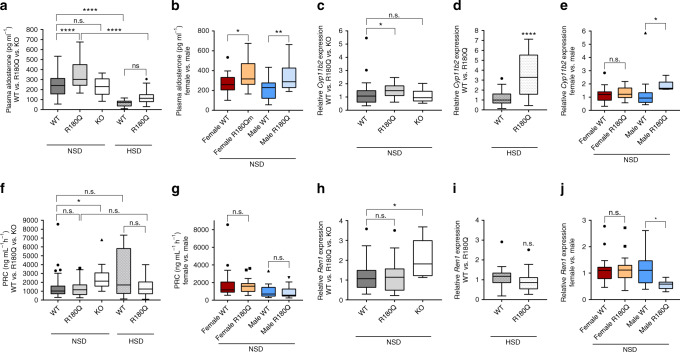
Fig. 4.
Clcn2R180Q/+ mice have elevated Cyp11b2 expression and plasma aldosterone levels. a, c, d Plasma aldosterone (WT: N = 37; Clcn2R180Q/+: N = 36; P < 0.0001; one-way ANOVA, Sidak´s MCP; F = 4.161; df = 120) and Cyp11b2 expression (WT: N = 32, 1.23 ± 0.17; Clcn2R180Q/+: N = 25, 1.47 ± 0.1; P = 0.0431; one-way ANOVA, Sidak´s MCP of log-transformed fold change; F = 2.907; df = 63) are significantly increased in Clcn2R180Q/+ mice. Clcn2−/− mice have unchanged plasma aldosterone (N = 10; P = 0.999; F = 4.313; df = 118) and Cyp11b2 expression (N = 10; P = 0.9959; both one-way ANOVA including Sidak´s MCP; F = 2.907; df = 63). HSD leads to suppressed aldosterone levels in WT (WT: N = 37; HSD-WT: N = 19; P < 0.0001) and Clcn2R180Q/+ (Clcn2R180Q/+: N = 36; HSD-Clcn2R180Q/+: N = 23; P < 0.0001; both one-way ANOVA, Sidak´s MCP; F = 4.313; df = 118). Cyp11b2 expression is upregulated in Clcn2R180Q/+ compared to WT (HSD-WT: N = 24; HSD-Clcn2R180Q/+: N = 27; P < 0.0001; Mann–Whitney test). b, e Plasma aldosterone is elevated in females (WT: N = 21; Clcn2R180Q/+: N = 23; P = 0.0323; df = 69) and males (WT: N = 16; Clcn2R180Q/+: N = 13; P = 0.0098; both one-way ANOVA, Bonferroni´s MCP; F = 5.589; df = 69), Cyp11b2 expression is upregulated only in male Clcn2R180Q/+ (WT: N = 15; Clcn2R180Q/+: N = 7; P = 0.0275; one-way ANOVA including Sidak´s MCP; F = 1.782; df = 53). f, h, i PRC is unchanged (WT: N = 37, 1474 ± 245.3 ng ml−1 h−1, Clcn2R180Q/+: N = 36, 1334 ± 138.7 ng ml−1 h−1, P > 0.9999; HSD-WT: N = 19, 2830 ± 590.3 ng ml−1 h−1; HSD-Clcn2R180Q/+: N = 23, 1522 ± 218.4 ng ml−1 h−1, P > 0.9999; both Kruskal–Wallis test, Dunn´s MCP). Ren1 expression is unchanged (WT: N = 32, 1.17 ± 0.12; Clcn2R180Q/+: N = 27, 1.16 ± 0.14; P = 0.9812; one-way ANOVA including Sidak´s MCP; F = 0.7894; df = 63; HSD-WT: N = 24, 1.26 ± 0.15; HSD-Clcn2R180Q/+: N = 27, 1.462 ± 0.23; P = 0.9813; Mann–Whitney test). In Clcn2−/−, the expression of Ren1 (WT: N = 32, 1.17 ± 0.12; Clcn2−/−: N = 10, 2.1 ± 0.32; P = 0.0125; one-way ANOVA including Sidak´s MCP; F = 0.7894; df = 63) and PRC (WT: N = 37, 1474 ± 245.3 ng ml−1 h−1; Clcn2−/−: N = 10, 2602 ± 546.1 ng ml−1 h−1; P = 0.03; Kruskal–Wallis test, Dunn´s MCP) are significantly upregulated compared to WT. g, j Female (WT: N = 21, 1839 ± 392 ng ml−1 h−1; Clcn2R180Q/+: N = 23, 1589 ± 166.3 ng ml−1 h−1; P > 0.9999;) as well as male mice (WT: N = 16, 995.1 ± 194.7 ng ml−1 h−1; Clcn2R180Q/+: N = 13, 882.6 ± 198 ng ml−1 h−1; P > 0.9999; both Kruskal-Wallis test; Dunn´s MCP) show no significant alteration in PRC. Ren1 expression is significantly downregulated in male Clcn2R180Q/+ mice only (WT: N = 15, 1.14 ± 0.16; Clcn2R180Q/+: N = 7, 0.57 ± 0.07; P = 0.0158; one-way ANOVA including Sidak´s MCP; F = 0.6378; df = 53). Mean ± SEM for all data in the legend; box plots (box, interquartile range; whiskers, 1.5 times the interquartile range; line, median; dots, outliers) are shown in the figure; N values are biologically independent animals. NSD, normal salt diet. *, p < 0.05; **, p < 0.01; ****, p < 0.0001; n.s., p > 0.05

