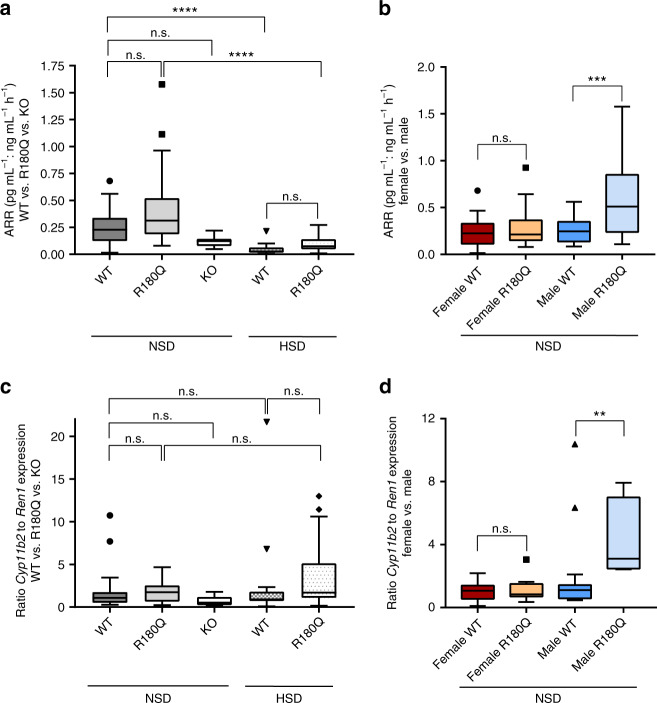
Fig. 5.
Male Clcn2R180Q/+ mice have elevated aldosterone:renin ratios. a Aldosterone:renin ratios (ARR) were calculated using values of plasma aldosterone levels and PRC. No significant differences were detected for Clcn2R180Q/+ mice compared to WT under normal salt (WT: N = 37; Clcn2R180Q/+: N = 36; P = 0.5892) as well as after HSD (HSD-WT: N = 19; HSD- Clcn2R180Q/+: N = 23; P = 0.3788; both Kruskal-Wallis test, Dunn´s MCP). In addition, ARR of Clcn2−/− mice was not significantly changed compared to WT (WT: N = 37; Clcn2−/−: N = 10; P = 0.2089; Kruskal–Wallis test, Dunn´s MCP). b Subgroup analysis showed increased ARR levels in male Clcn2R180Q/+ mice compared to WT (WT: N = 16; Clcn2R180Q/+: N = 13; P = 0.0010; one-way ANOVA including Bonferroni´s MCP; F = 6.896; df = 69), but not in female mice (WT: N = 21; Clcn2R180Q/+: N = 23; P = 0.8346; one-way ANOVA including Bonferroni´s MCP; F = 6.896; df = 69). c A ratio of Cyp11b2 and Ren1 expression was calculated using fold change. There is no significant difference between Clcn2R180Q/+ and WT mice as well as Clcn2−/− compared to WT (WT: N = 32; Clcn2R180Q/+: N = 25; P = 0.8622; Clcn2−/−: N = 10, P = 0.6780; Kruskal–Wallis test, Dunn´s MCP). After HSD, the ratio was slightly increased in Clcn2R180Q/+ mice compared to WT (HSD-WT: N = 24; HSD-Clcn2R180Q/+: N = 27; P = 0.0711; Kruskal–Wallis test, Dunn´s MCP). d The ratio was significantly increased in male Clcn2R180Q/+ mice compared to WT (WT: N = 15; Clcn2R180Q/+: N = 7; P = 0.0039; Kruskal–Wallis test and Dunn´s MCP), but not in female mice (WT: N = 17; Clcn2R180Q/+: N = 18; P > 0.9999; Kruskal-Wallis test and Dunn´s MCP). All data are shown in box plots (box, interquartile range; whiskers, 1.5 times the interquartile range; line, median; dots, outliers); N values are biologically independent animals. **, p < 0.01; ***, p < 0.001; ****, p < 0.0001; n.s., p > 0.05

