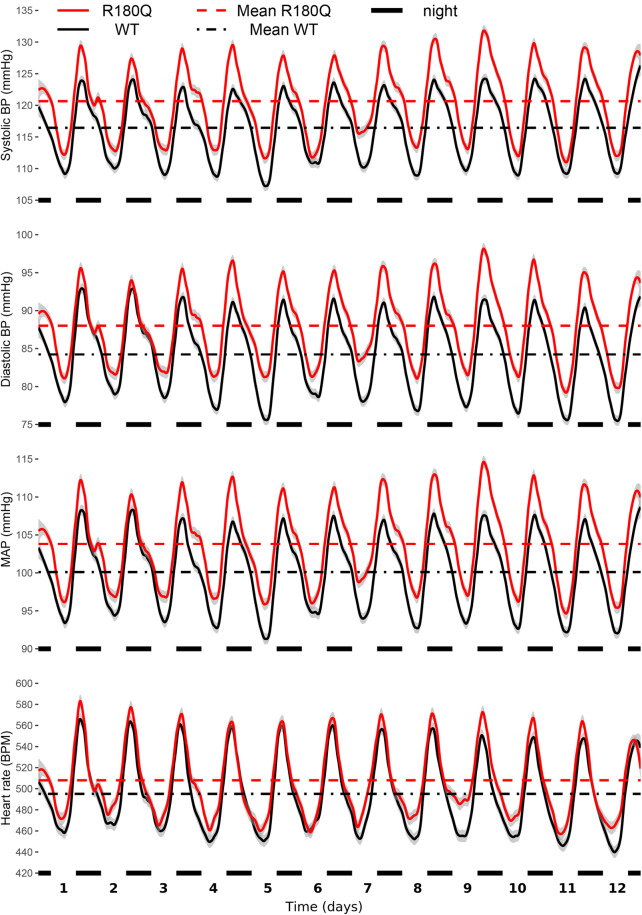
Fig. 7.
Clcn2R180Q/+ mice have higher blood pressure. Blood pressure (BP) and heart rate (HR) of animals assessed through telemetry sensors. Shown are loess regressions of BP/HR of WT (black, N = 18 biologically independent animals) and Clcn2R180Q/+ (red, N = 18 biologically independent animals) animals, with gray intervals denoting 95% confidence intervals for loess regressions. Horizontal axis shows time, with black markers noting nights (active periods of nocturnal animals). Horizontal lines show mean for the entire measurement period for WT (black dash-dotted) and Clcn2R180Q/+ (red dashed) animals. Nested-model likelihood ratio comparisons reveal significantly higher BP (systolic, P = 0.007; diastolic P = 0.020, MAP, P = 0.009) of Clcn2R180Q/+ animals than WT and unchanged HR (p=0.225). Average (mean ± SEM for all) systolic BP is 116.4 ± 0.1 mmHg (WT) and 120.6 ± 0.1 mmHg (Clcn2R180Q/+). Average diastolic BP is 84.2 ± 0.1 mmHg (WT) and 88.0 ± 0.1 mmHg (Clcn2R180Q/+). Average MAP is 100.1 ± 0.1 mmHg (WT) and 103.8 ± 0.1 mmHg (Clcn2R180Q/+). Average HR is 495.2 ± 0.4 BPM (WT) and 507.9 ± 0.4 BPM (Clcn2R180Q/+)

