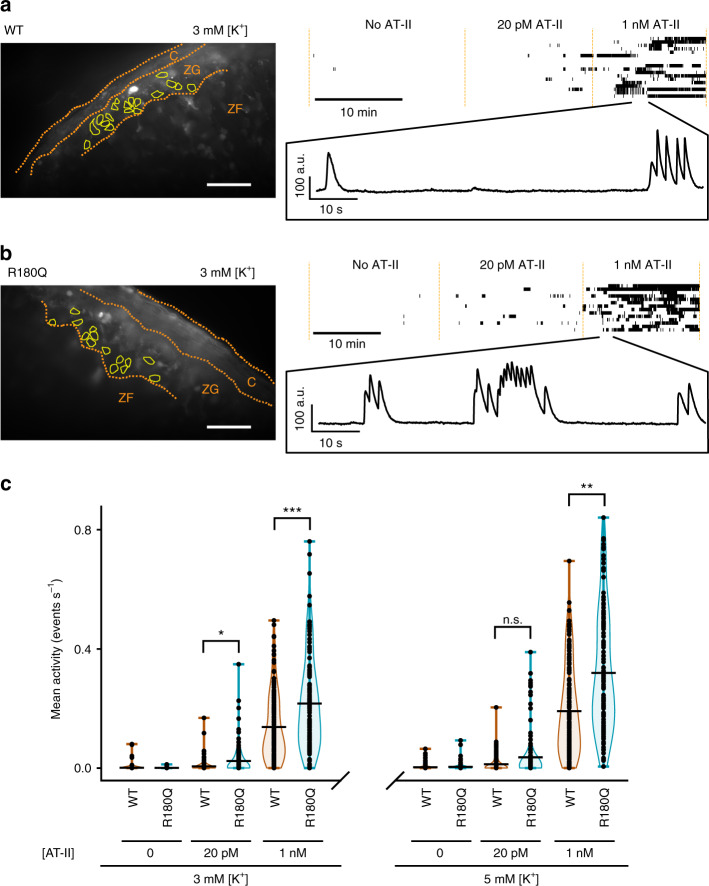
Fig. 8.
Clcn2R180Q/+ mice have altered glomerulosa calcium signaling. a, b Left, representative average projection of 10 frames (1 s) without AT-II of a recording of calcium signals from acute adrenal slice preparations of either (a) wildtype (WT) or (b) Clcn2R180Q/+ mice (R180Q). Scale bar: 50 µm. Borders of the capsule (C), zona glomerulosa (ZG) and the outer part of the zona fasciculata (ZF) are shown in orange. Bright white spots likely correspond to apoptotic cells. Cells (yellow outlines) were selected from the recording, and mean intensity values over time were extracted. Top right, activity of all selected cells is shown in a burst plot. Cells are separated in rows along the y-axis, with time displayed along the x-axis. Detected spikes of the calcium signal are plotted as vertical lines with multiple spikes in close proximity merging into longer bars. Extracellular solution was perfused continuously and changed at the time points indicated. Representative examples of variations in the fluorescence recorded at 1 nM of AT-II are shown in a magnified inset. (c) Violin plots of cellular activity (WT in orange, Clcn2R180Q/+ in blue) in the zona glomerulosa as determined by the number of spikes per cell and second. All data points are shown, a black horizontal bar denotes the mean of the distribution. (N (cells): 3 mM [K+], no AT-II – WT: N = 126, Clcn2R180Q/+N = 134, not tested; 3 mM [K+], 20 pM AT-II - WT: N = 134, Clcn2R180Q/+N = 134, χ2(1) = 5.3413, P = 0.0208 (*); 3 mM [K+], 1 nM AT–II - N = 157, Clcn2R180Q/+N = 134; χ2(1) = 11.97, P = 0.0005 (***); 5 mM [K+], no AT-II – WT: N = 150, Clcn2R180Q/+N = 134, not tested; 5 mM [K+], 20 pM AT-II - WT: N = 153, Clcn2R180Q/+N = 134, χ2(1) = 3.2957, P = 0.0695 (n.s.); 5 mM [K+], 1 nM AT–II - N = 154, Clcn2R180Q/+N = 134, χ2(1) = 8.3487, P = 0.0039 (**); likelihood ratio test)

