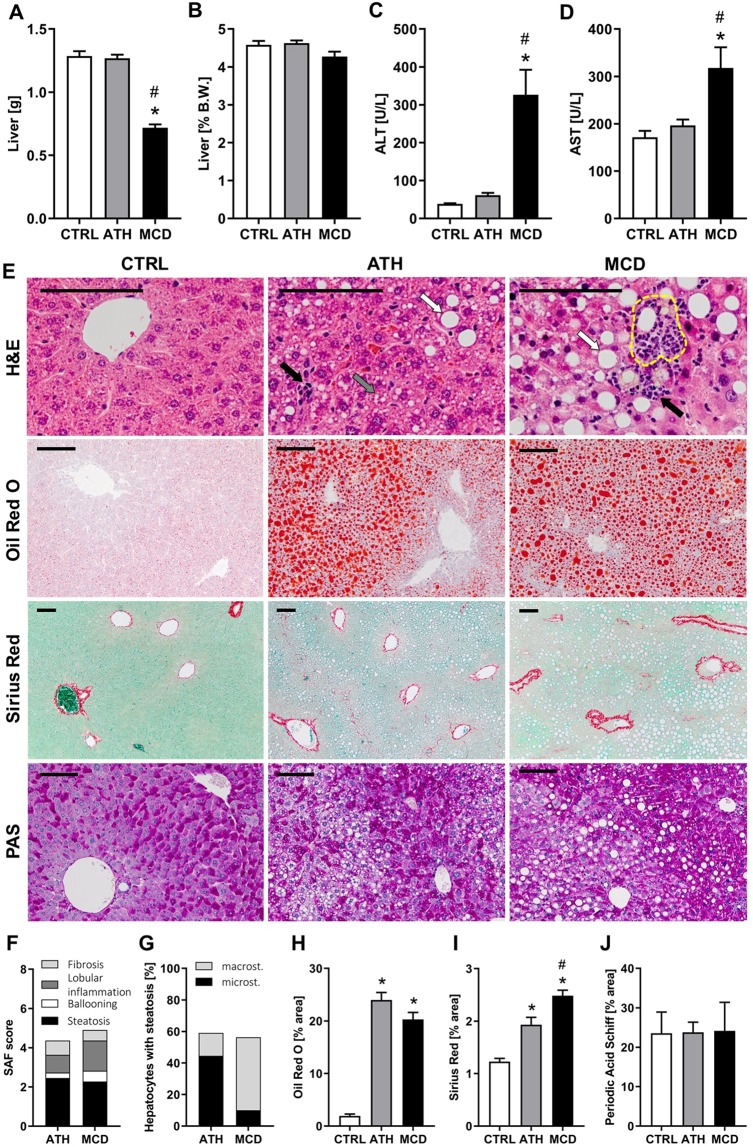
Figure 1.
ATH and MCD diets induce similar degree of steatosis, but different NASH severity. Liver weight expressed in grams (A) and as percentage of body weight. (B) Plasma levels of liver enzymes: ALT (C) and AST. (D) Liver histology: hematoxylin and eosin (H&E), Oil Red O, Sirius Red and periodic acid Schiff (PAS). (E) SAF score with Steatosis, Activity (lobular inflammation + ballooning) and Fibrosis. (F) Evaluation of the percent of hepatocyte containing micro- and macrosteatosis. (G) Quantification of lipids (H), collagen (I) and glycogen (J) expressed as percent of area stained respectively with Oil red O, Sirius Red and PAS. Scale bars 100 µm, black arrows: immune cell infiltration, white arrows: macrosteatosis, grey arrow: microsteatosis, yellow dashed circle: lipogranuloma. One-way ANOVA: *p value ATH/MCD vs CTRL < 0.05, #p value MCD vs ATH < 0.05.

