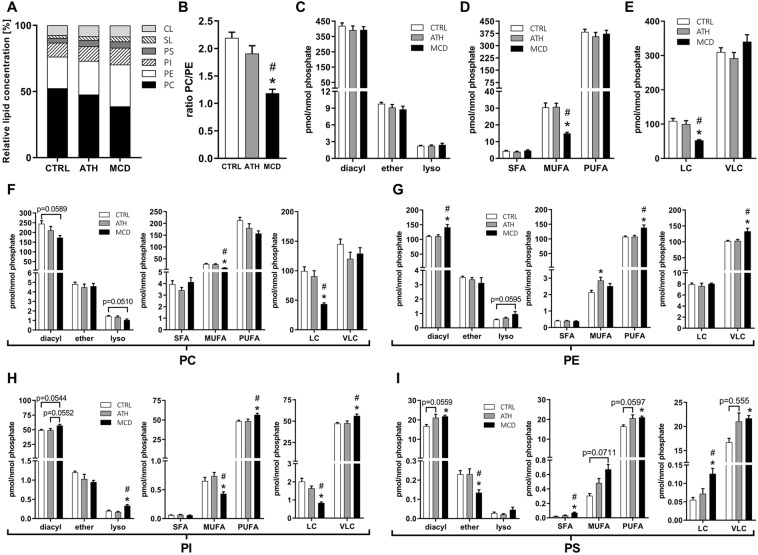
Figure 5.
Liver lipidomics highlights effects of ATH and MCD diets on phospholipid homeostasis including phospholipid composition, fatty acid chain length and level of desaturation. Relative concentration of lipid classes. (A) Phosphatidylcholine to phosphatidylethanolamine ratio. (B) Total amount of PC, PE, PI and PS represented according to the nature of the fatty acid linkage (diacyl vs alkyl-acyl (ether) or monoacyl (lyso) (C), degree of saturation (D) or chain length (E). Same as in ‘C-E’ but separately for phosphatidylcholine (F), phosphatidylethanolamine (G), phosphatidylinositol (H) or phosphatidylserine. (I) PC: phosphatidylcholine, PE: phosphatidylethanolamine, PI: phosphatidylinositol, PS: phosphatidylserin1e, SL: sphingolipids, CL: cardiolipin, diacyl: diacylphospholipids, ether: alkyl-acyl-containing phospholipids, lyso: lysophospholipids, SFA: saturated fatty acids, MUFA: monounsaturated fatty acids (total sum of 1 double bond in both fatty acyl chains), PUFA: polyunsaturated fatty acids (total sum of 2–6 double bonds in both fatty acyl chains), LC: long chains (total sum of 28–34 carbons in both fatty acyl chains), VLC: very long chains (total sum of 36–44 carbons in both fatty acyl chains). One-way ANOVA: *p value ATH/MCD vs CTRL < 0.05, #p value MCD vs ATH < 0.05.

