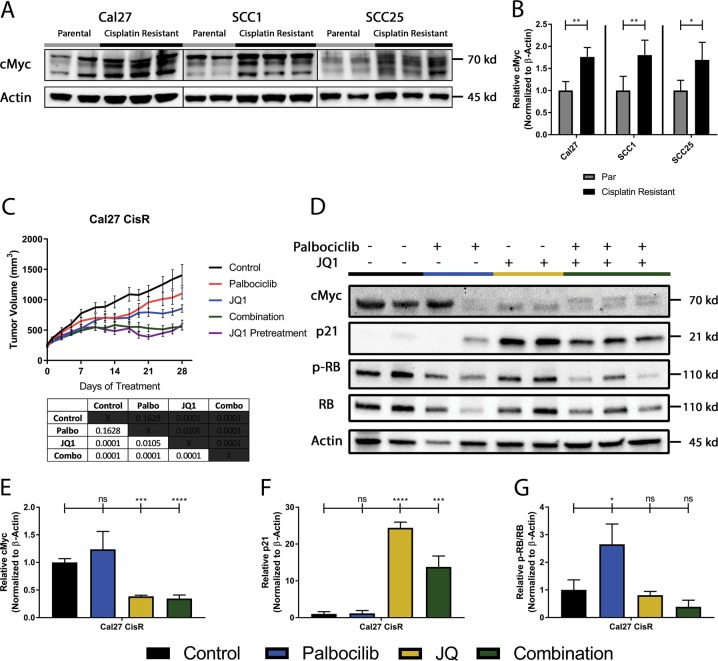
Fig. 5. Cisplatin-resistant lines display up-regulated c-Myc expression and treatment with BET family protein inhibitor synergizes with Palbociclib treatment.
a Representative immunoblots of c-Myc and actin for tumor cell lysates harvested from parental and cisplatin-resistant xenografts after 48 h of treatment with palbociclib. b Quantification of c-Myc and actin for tumor cell lysates harvested from parental (gray) and cisplatin-resistant (black) xenografts by photo densitometry was performed on bands using Image Lab Software, and normalized to β-actin loading control for c-Myc. c Tumor growth curves for cisplatin-resistant xenografts treated daily with vehicle (black), single agent palbociclib at 70 mg/kg (red), single agent JQ1 at 70 mg/kg (blue), combination therapy (green), or combination therapy pre-treated with JQ1 for the first 7 days with palbociclib added daily starting at day 7 (purple). n = 5 per group, summarized as mean ± SEM. d Representative immunoblots of c-Myc, p21, p-Rb, total Rb, and actin for tumor cell lysates harvested from xenografts treated with vehicle (black), palbociclib (blue), JQ1 (yellow), or combination therapy (green) after 28 days of treatment. e Quantification by photo densitometry normalized to β-actin loading control for c-Myc. f Quantification by photo densitometry normalized to β-actin loading control for p21. g Calculation by photo densitometry normalized to β-actin loading control of the ratio of p-Rb/total Rb. All quantification is presented as mean ± SD. (*p ≤ 0.05, **p ≤ 0.01, ***p ≤ 0.001, ****p ≤ 0.0001, by Student’s t-test)

