Figure 3.

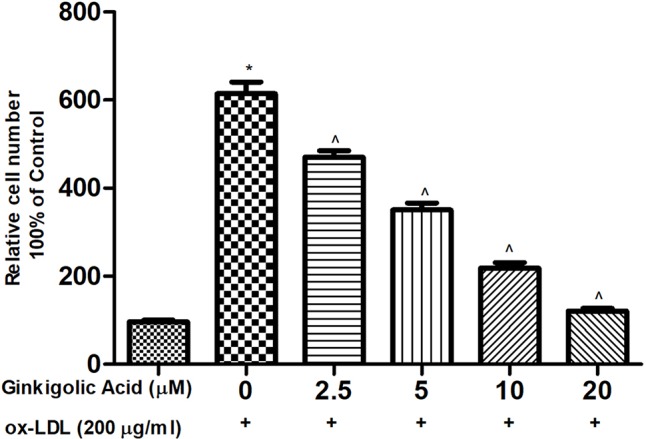
Showed the effect of ginkigolic acid on ox-LDL–induced ROS level. Data are presented as Mean ± SEM, *p < 0.05, compared to the control group (without treatment), ^p < 0.05, compared to ox-LDL group.

Showed the effect of ginkigolic acid on ox-LDL–induced ROS level. Data are presented as Mean ± SEM, *p < 0.05, compared to the control group (without treatment), ^p < 0.05, compared to ox-LDL group.