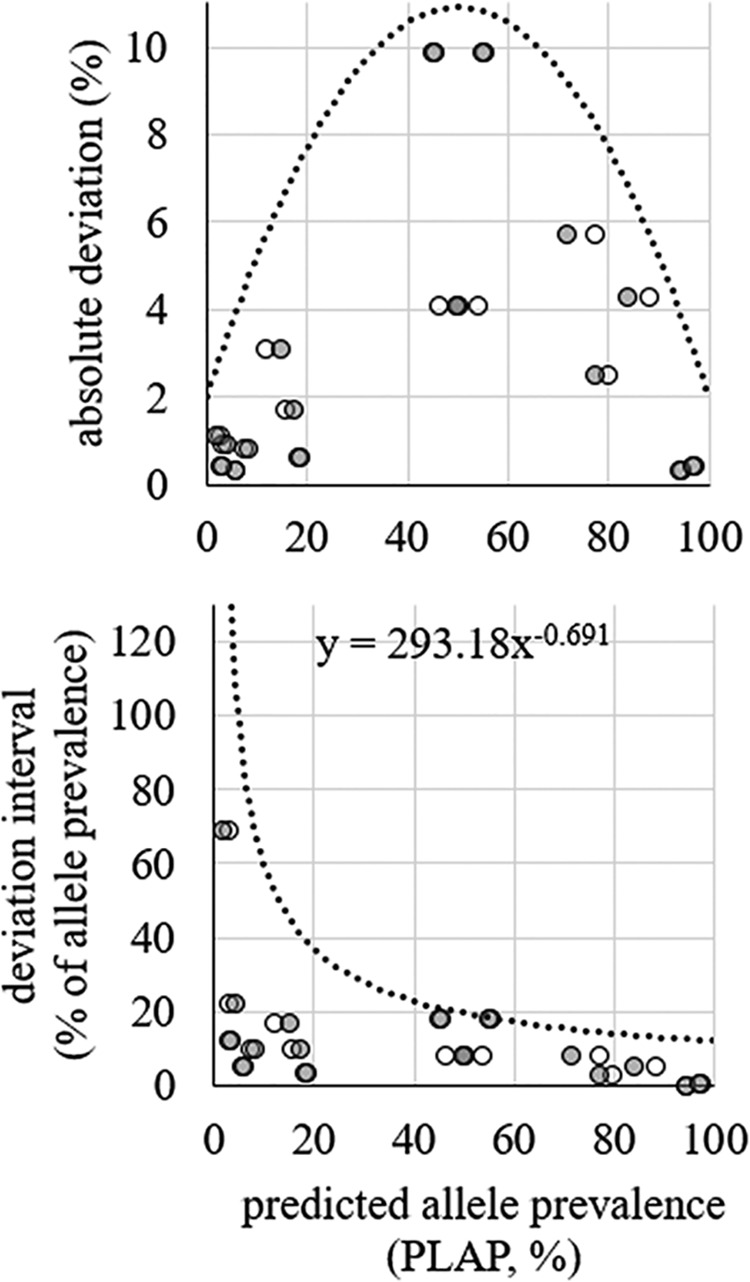
FIG 4.

Difference in predicted prevalence between fumC and fimH alleles from the same E. coli strain. Deviation in absolute numbers (top) and deviation as a percentage of the prevalence of the allele (bottom) are shown. The open circles indicate fimH data points. The shaded circles indicate fumC data points. Trend lines and equations were used to determine intervals for matching (i.e., belonging to the same CH type) fumC and fimH alleles.
