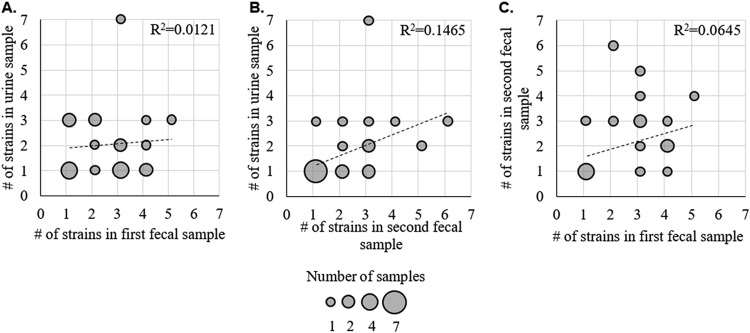
FIG 7.
Counts of E. coli strains in fecal and urine samples. Shown are the numbers of strains detected by PLAP in the first fecal sample versus urine (A), second fecal sample versus urine (B), and first fecal sample versus second fecal sample (C). Each circle represents participants with the corresponding number of E. coli strains in the designated sample. The circle size indicates the number of participants with the determined number of strains. The linear fit with the Pearson square correlation index shown.

