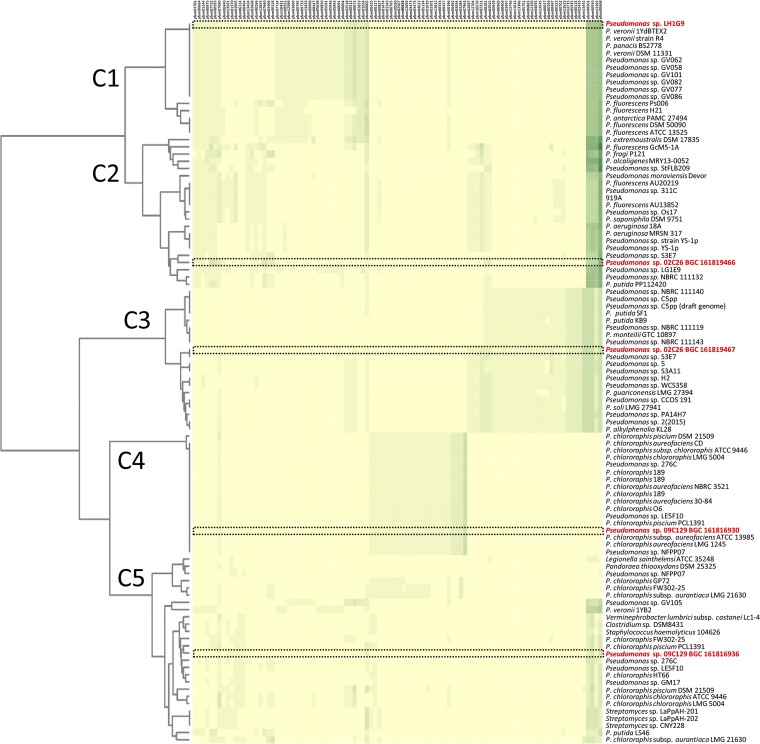
FIG 5.
Heat map of similar Pfam protein families in the JGI ABC to 02C26, LH1G9, 09C129, and LG1D9 BGCs. The 95 most similar BGCs were identified and used to show similarities and differences within each cluster. Five clades were generated in the analysis, C1 to C5. The JGI ABC Pfam designations are listed on the top x axis and correspond to Table S11. The heat map color shading represents the number of each Pfam protein family in a BGC. Unique, single, and multiple protein families in a BGC range from 0 to 5, with yellow representing 0 protein families and lightest green to darkest green representing 1 to 5 protein families. The left y axis consists of BGC phylogeny determined by number and content of similar protein families. Tree branch lengths were determined using the Jaccard index scores of all protein families. The right y axis lists strains, with 02C26, LH1G9, and 09C129 in red; their BGC is boxed with a black dashed line.

