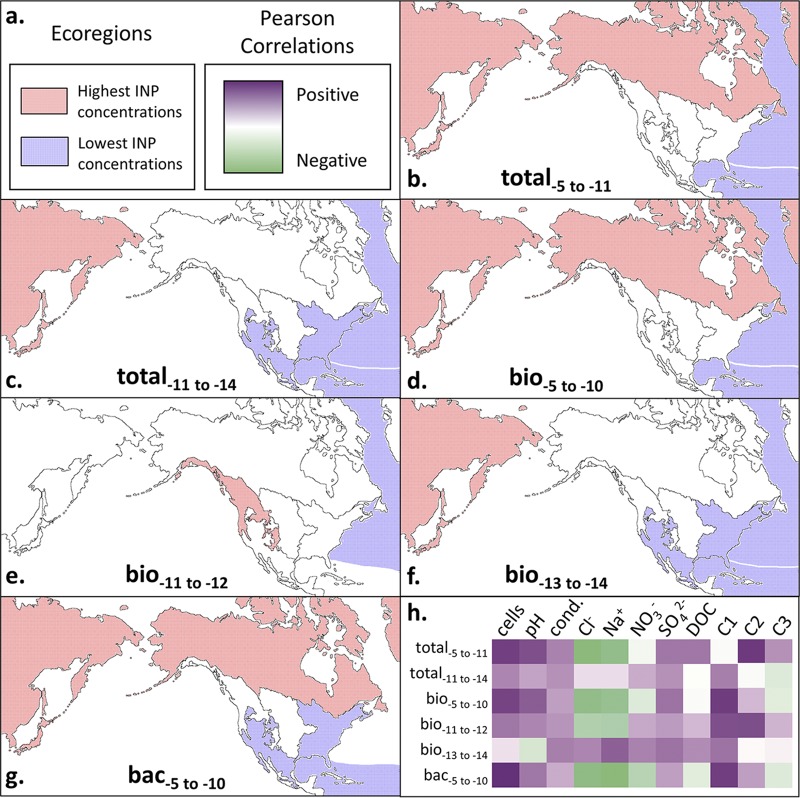
FIG 6.
Summary of trends in ice-nucleating particle (INP) data with source ecoregion and physical, chemical, and microbiological properties of the precipitation. Ecoregions as depicted in Fig. 4 are outlined by black solid lines. (a) Key for INP concentrations in the ecoregion for panels b to g and Pearson correlation coefficents for panel h are shown. (b to g) Ecoregions that correlated significantly with total−5 to −11 (b), total−11 to −14 (c), bio−5 to −10 (d), bio−11 to −12 (e), bio−13 to −14 (f), and bac−5 to −10 (g) INP concentrations are shown. (h) Heat plot of Pearson correlation coefficients between INP concentrations and various precipitation measurements, as follows (units): cell abundance (cells liter−1 precipitation); conductivity (cond.; μS cm−1); chloride, sodium, nitrate, and sulfate (μM); DOC, dissolved organic carbon (parts per million); C1, PARAFAC component C1 (Raman units [R.U.]); C2, PARAFAC component C2 (A.U.); and C3, PARAFAC component C3 (A.U.).

