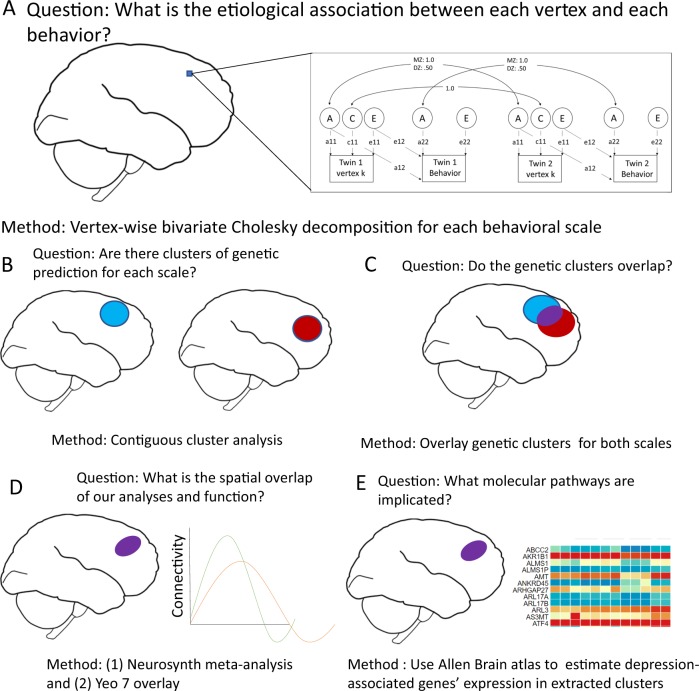
Fig. 1. Five steps for whole-cortex mapping by genetic association and follow-up using informatic tools.
a Additive genetic (A), Common environmental (C) and non-shared Environmental (E) Cholesky decomposition is used to find the etiological association of each vertex with each behavioral scale. Multiplication of standardized paths labeled 11 and 12 represents the phenotypic correlations predicted by additive genetic (bivariate heritability) and non-shared environmental (bivariate environmentality) influences, respectively. b Vertices whose associations with behavior are significant (p < 0.05) and are part of a contiguous cluster of larger than 20 mm (cluster-extent correction) are estimated across the cortex surface separately by each trait and separately for A and E components. This procedure recovered four categories of clusters: additive genetic clusters influencing CESD, additive genetic clusters influencing ICU, non-shared environmental clusters influencing CESD, and non-shared environmental clusters influencing ICU. c Areas that represent significant conjunction of genetic association are created by overlaying the genetic clusters from CESD and ICU after cluster-extent correction. d The coordinates for overlap were transformed in MNI space and were used to map onto the Yeo 7 functional connectivity patterns and conduct meta-analytic term searches of likely associated functions. e Genes associated with depression in a large genome-wide association study were extracted from Neurosynth-gene/Allen Brain Atlas dataset to examine the expression of each of those genes in our clusters

