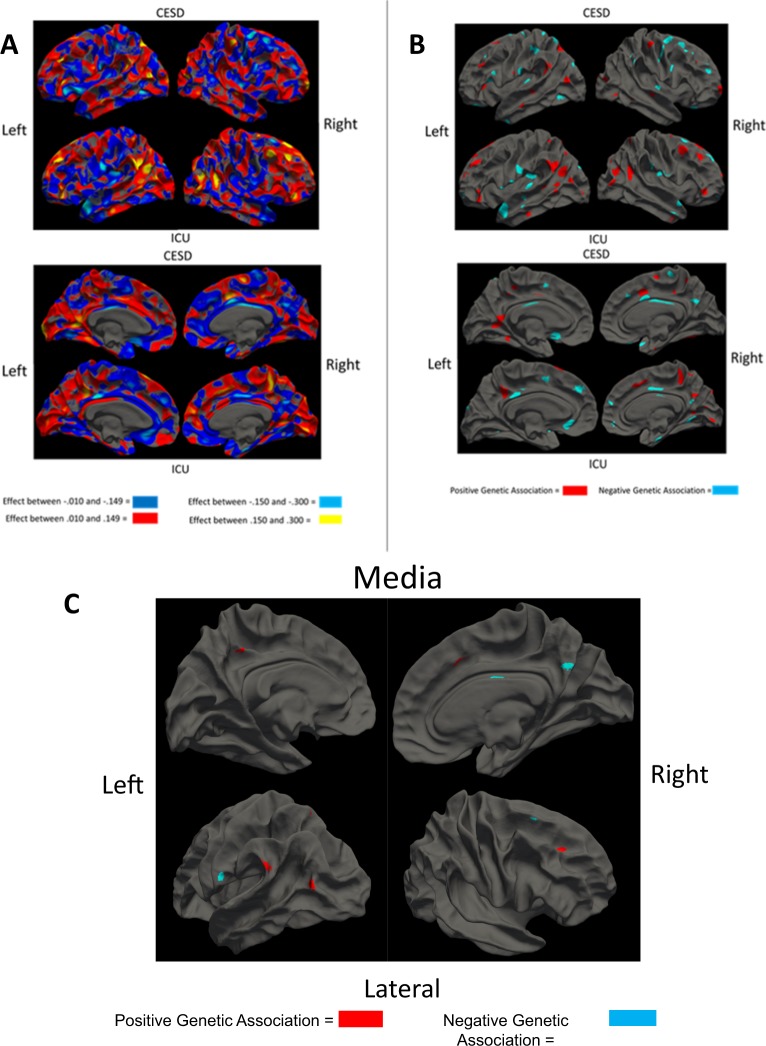
Fig. 3. Neural associations with the Center for Epidemiological Studies Depression scale (CESD) and Inventory of Callous and Unemotional traits (ICU).
a Depicts whole-cortex heat maps of the genetic association of each vertex with each behavioral measure as bivariate heritability. b Depicts p-values for genetic association between each vertex and each behavioral scale below cluster-corrected significance (p < 0.05). Lateral views are on top and medial views below. These analyses correspond to those outlined by Fig. 1b. c Depicts overlap areas for our genetic clusters. These genetic clusters coordinates were used in all future analyses

