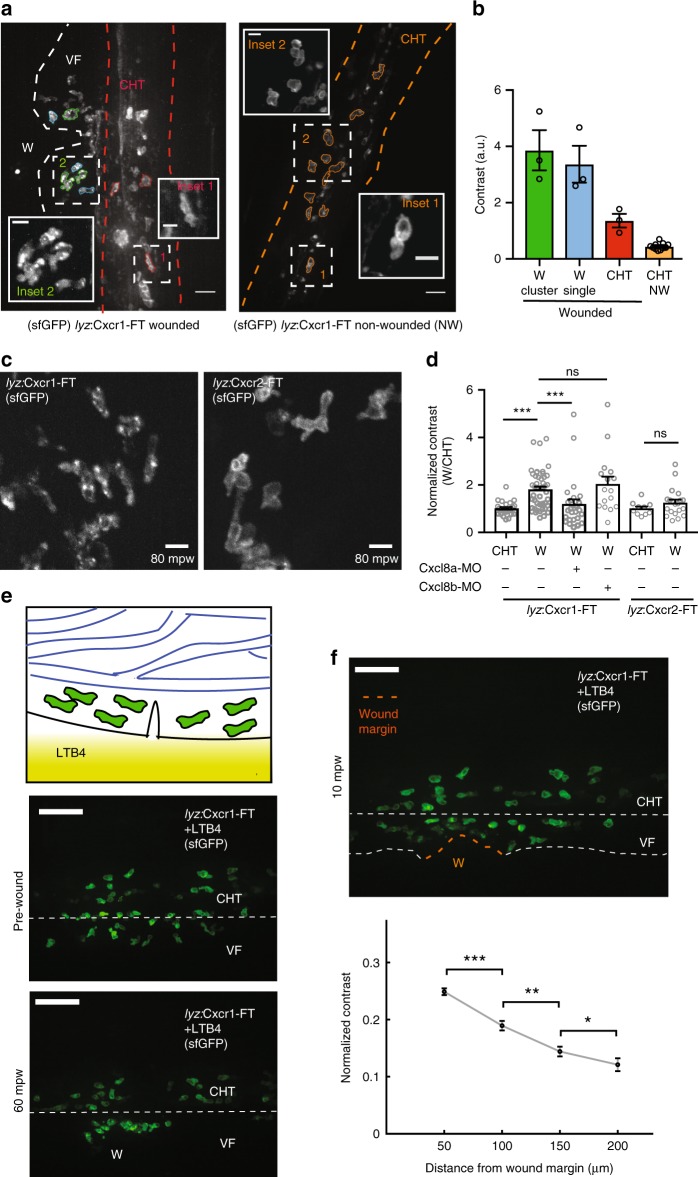
Fig. 2.
Distinct trafficking of Cxcr1 and Cxcr2 during neutrophil migration to wounds. a Overview of receptor distribution patterns and corresponding quantitative approach. Confocal projection of neutrophils in a representative wounded or unwounded Tg(lyz:Cxcr1-FT) larva. Examples of cells are shown in different colors: single (blue) or clustered (green) cells at the wound, cells in the CHT of the same wounded larva (red) or cells in the CHT of an unwounded larva (orange). CHT: caudal hematopoietic tissue, VF: ventral fin, W: wound. b Calculation of contrast from the cells segmented in a. n = 3 (green, blue, red), n = 11 (orange) cells. Scale bar = 25 µm, scale bar (insets) = 10 µm. c Confocal projection of neutrophils in Tg(lyz:Cxcr1-FT) or Tg(lyz:Cxcr2-FT) larvae at the wound focus. Scale bar = 10 µm. mpw = minutes post wound. d Normalized contrast (contrast per individual neutrophil normalized to the mean contrast of non-mobilized cells in the CHT). Cxcl8a refers to injection of a splice-blocking together with a translation-blocking morpholino for cxcl8a. cxcl8b refers to injection with a splice-blocking morpholino for Cxcl8b. For Tg(lyz:Cxcr1-FT): n = 24 cells (CHT), n = 47 cells (wound) from 8 larvae. For Tg(lyz:Cxcr1-FT) with morpholinos: n = 28 cells (Cxcl8a-MO) from 5 larvae, n = 16 cells (Cxcl8b-MO) from 5 larvae. For Tg(lyz:Cxcr2-FT): n = 10 cells (CHT) and n = 20 cells (wound) from 3 larvae. Data were pooled from independent larvae acquired in 1 to 5 imaging sessions. Kruskal–Wallis test with Dunn’s multiple comparisons test for Tg(lyz:Cxcr1-FT), two-tailed unpaired Mann–Whitney test for Tg(lyz:Cxcr2-FT). e Top: cartoon depicting neutrophils in the CHT after mobilization to the ventral fin in response to an exogenous LTB4 gradient. Bottom: confocal projections of Cxcr1-FT neutrophils 30 min after LTB4 addition, right before (middle) and 1 h after wound (bottom). Scale bar = 50 µm. f Same larva as in e, at 10 mpw. Orange dashed line shows the wound margin. Graph below shows normalized contrast of individual neutrophils as a function of distance from the nearest point in the wound margin. For normalization, values were divided by the maximum contrast of each movie. n > 92 cells or clustered cells per bin, from 3 larvae in 3 imaging sessions. Two-tailed unpaired Mann–Whitney test. Error bars represent S.E.M. across cells. Source data are provided as a Source Data file

