Figure 3.
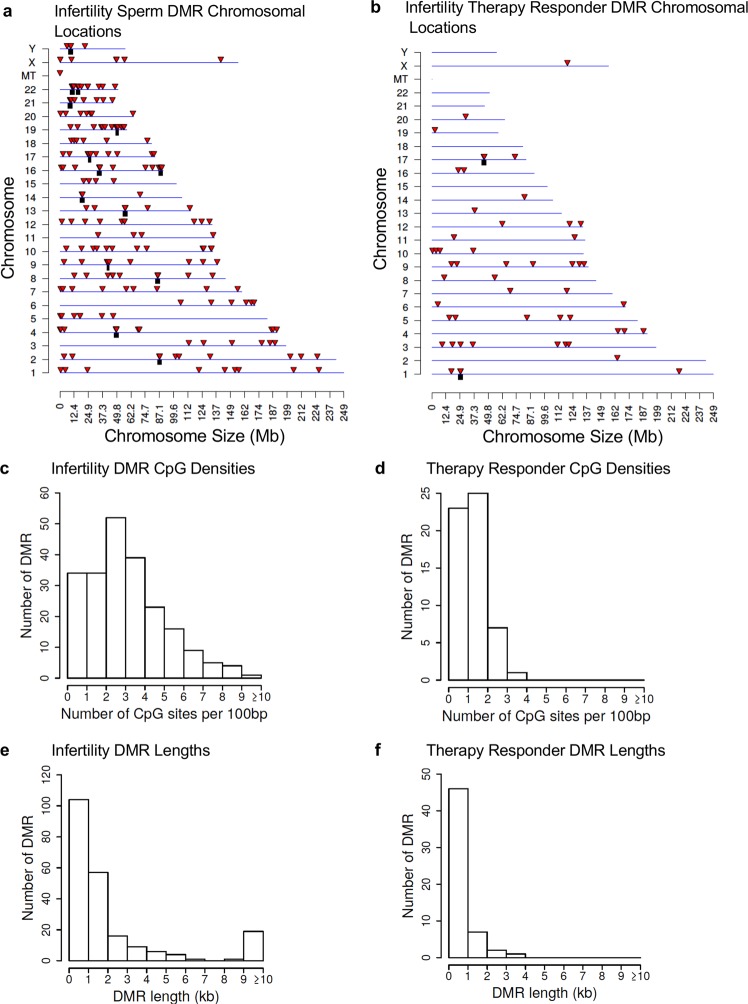
DMR genomic characteristics. (a) Chromosomal Locations of Fertility vs Infertility DMR Analysis. The DMR locations on the individual chromosomes. All DMRs at a p-value threshold of p < 1e-05 are shown with the red arrowhead and clusters of DMRs with the black boxes. (b) Responder DMR Signature Chromosomal Locations. The DMR locations (red arrowhead) and clusters of DMRs (black box) on the individual chromosomes. All DMRs at a p-value threshold of p < 1e-05 are shown. (c) DMR CpG density in the Fertility vs Infertility DMRs. The number of DMRs at different CpG densities. All DMRs at a p-value threshold of p < 1e-05 are shown. (d) The Responder signature DMR CpG density (number per 100 bp). The number of DMRs at different CpG densities are presented. All DMRs at a p-value threshold of 1e-05 are shown. (e) Fertility vs Infertility DMR lengths in kilobases. All DMRs at a p-value threshold of 1e-05 are shown. (f) The Responder signature DMRs size in kilobases. All DMRs at a p-value threshold of 1e-05 are shown.

