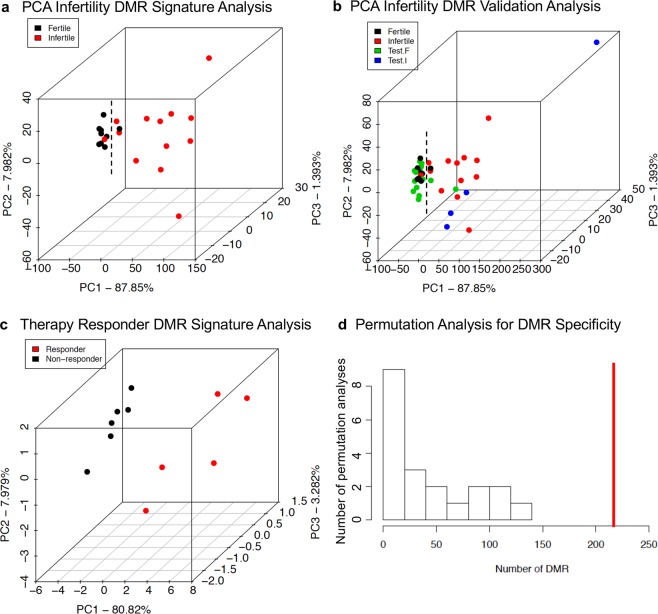
Figure 4.
Principal component analysis. (a) Fertility vs Infertility DMR Principal Component Analysis for Individuals. The samples are plotted by the first three principal components. The underlying data is the RPKM read depth for the DMRs. The color code is listed for the fertile and infertile patients. (b) Fertility vs Infertility DMR Principal Component Analysis for Individuals. The samples are plotted by the first three principal components. The underlying data is the RPKM read depth for the DMRs. The color code is listed for the fertile and infertile patients. Selection failure correlations for fertile and infertile patients not used to generate the epigenetic signature. PCA Infertile vs Fertile p < 10−5. (c) Responder and non-responder PCA analysis for DMRs at p < 1e-05. The first three principal components used and samples color code index indicated. The underlying data is the RPKM read depth for all DMRs. (d) The number of DMR for fertility versus infertility comparison for all permutation analyses. The vertical red line shows the number of DMR found in the original analysis. All DMRs are defined using an edgeR p-value threshold of p < 1e-05.

