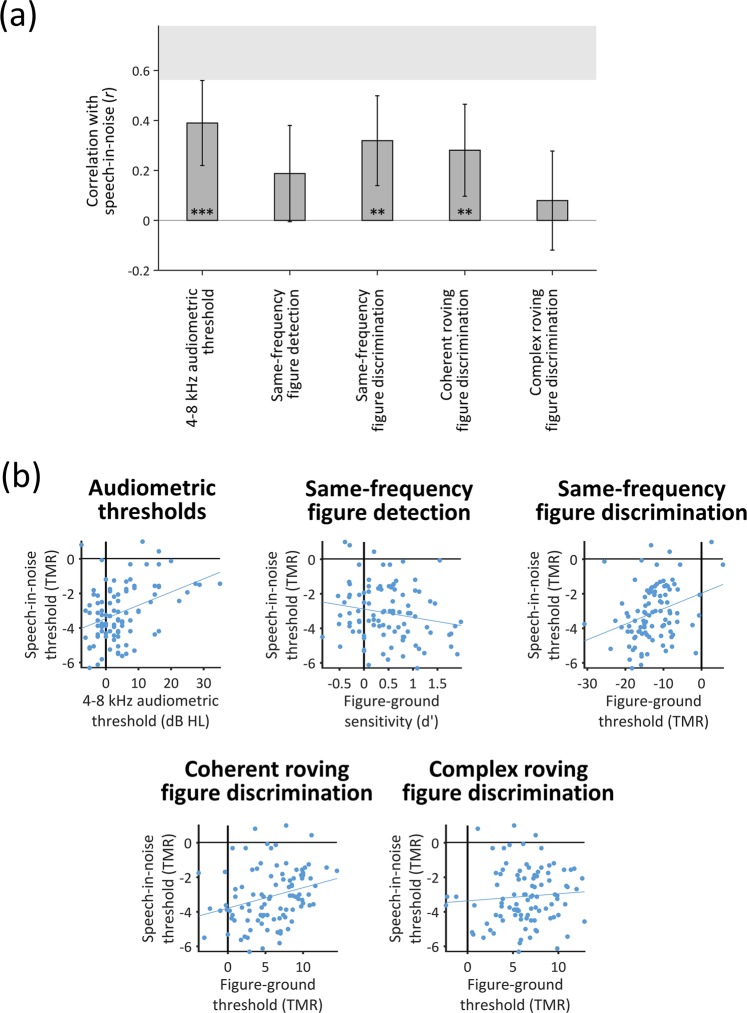
Figure 3.
Correlations between thresholds for speech-in-babble and audiometric thresholds or thresholds for the figure-ground tasks. (A) Bar graph displaying r-values for Pearson’s correlations with speech-in-babble thresholds. Error bars display 95% between-subjects confidence intervals for the correlation coefficients. The grey shaded box illustrates the noise ceiling, calculated as the (95% between-subjects confidence interval associated with the) correlation between two different blocks of the speech in noise task. Asterisks indicate the significance level of the correlation coefficient (*p < 0.050; **p < 0.010; ***p < 0.001). (B) Scatter plots associated with each of the correlations displayed in Panel A. Each dot displays the results of an individual participant. Solid grey lines indicate the least squares lines of best fit (note that the error bars in Panel A display the normalised confidence intervals for these regressions). [dB HL: decibels hearing level; TMR: target-to-masker ratio.] See also Supplemental Figure.

