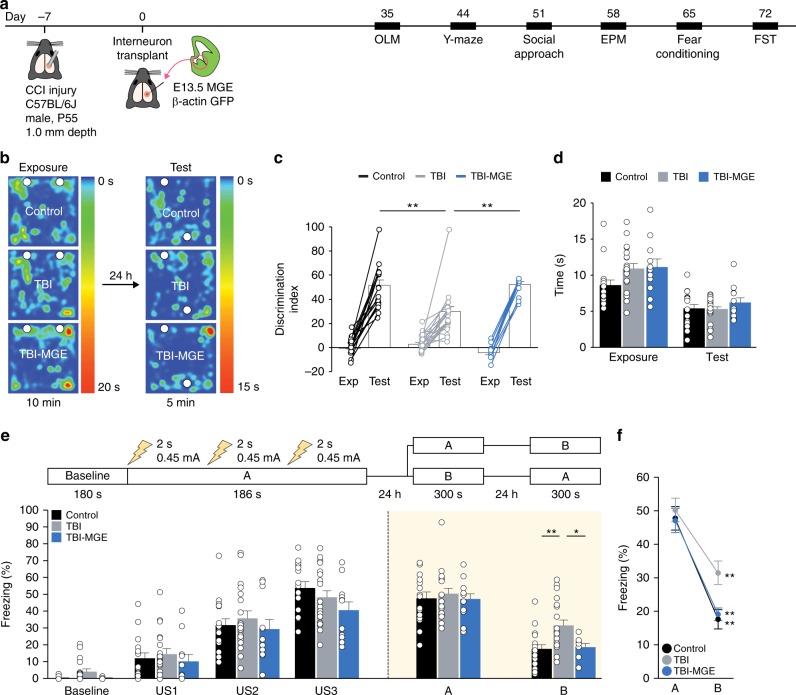
Fig. 5.
MGE transplantation improves memory after TBI. a Schematic showing the timeline for behavior experiments. OLM object location memory, EPM elevated plus maze, FST forced swim test. b Heatmap showing the location of control, TBI and TBI-MGE mice during exposure and testing phases of the OLM assay. c Discrimination index for each individual mouse and group means during exposure and testing phases of OLM. **P = 0.002, control vs TBI; **P = 0.004, TBI vs TBI-MGE; one-way ANOVA with Bonferroni post hoc test. n = 16 control mice, 19 TBI mice and 11 TBI-MGE mice. d Total time spent exploring the objects during exposure phase and test phase of OLM. e Top, schematic of the contextual fear conditioning paradigm. Bottom, quantification of freezing behavior in contexts A and B. **P = 0.004, control vs TBI; *P = 0.03, TBI vs TBI-MGE; one-way ANOVA with Bonferroni post hoc test. n = 16 control mice, 19 TBI mice and 11 TBI-MGE mice. US, unconditioned stimulus (i.e., foot shock). f Quantification of freezing in contexts A and B. **P = 0.000008, control; **P = 0.000004, TBI; **P = 0.00002, TBI-MGE; two-tailed paired t-tests. Error bars, s.e.m. See Supplementary Data 1 for statistical analyses. Source data are provided as a Source Data file

