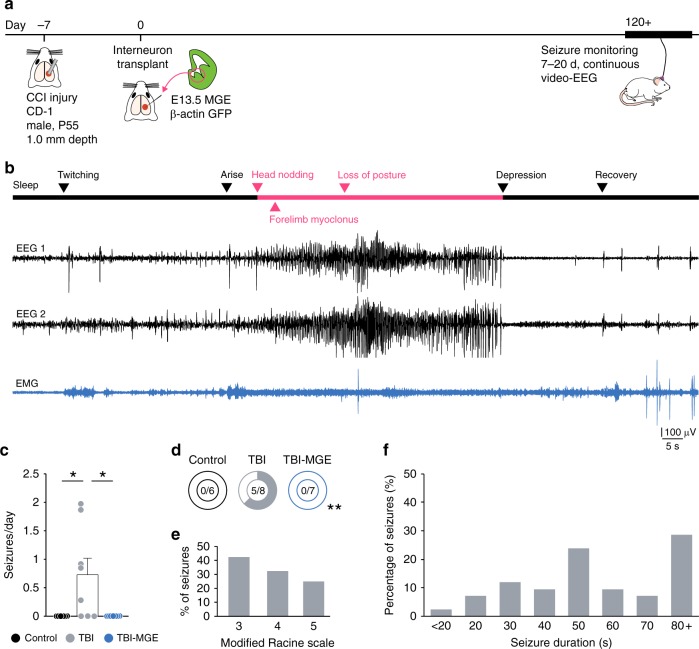
Fig. 7.
Brain injured mice are seizure free after MGE transplantation. a Schematic showing the timeline for EEG experiments. b Example EEG recording (black) and corresponding EMG recording (blue) during a spontaneous seizure from a mouse 123 d after TBI. Arrows indicate behaviors observed at each phase of the recording. c Quantification of spontaneous seizure frequency (seizures per d) based on continuous EEG recordings (7–20 d). *P = 0.04, control vs TBI; *P = 0.03, TBI vs TBI-MGE; one-way ANOVA with Bonferroni post hoc test. n = 6 control mice, 8 TBI mice and 7 TBI-MGE mice. d Percentage of mice with spontaneous electrographic seizures. **P = 0.004; Fisher exact test. e Distribution of seizure behavior based on a modified Racine rating scale. f Distribution of seizure duration in 10 s bins. See Supplementary Data 1 for statistical analyses. Error bars, s.e.m. Source data are provided as a Source Data file

