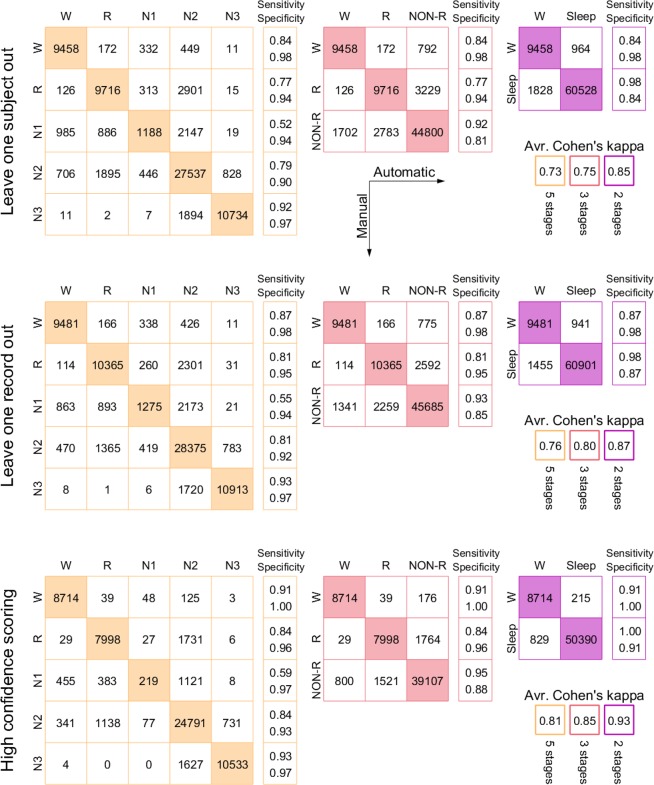
Figure 5.
Confusion Matrices: Comparison between manual scoring and the results from 3 different methods of classifier training, for different ways of scoring the recordings. Each describes results for 5, 3 and 2 sleep stages (in the second, N1, N2 and N3 are grouped, in the last, REM is added to that as well). Numbers signify epoch counts. In the top row, the classifier was trained on all recordings from all other study participants. In the middle row, it was trained on all other recordings in total (including the other three from the same participant). In the bottom row, the classifier was trained on all recordings from all other subjects (like the top row), but in the output only those epochs which had greater than 50% confidence were included. This amounted to excluding 18% of epochs. On the right is shown average Cohens kappa (averaged over all recordings). Note that the 3 and 2-stage scorings were computed by grouping the 5-stage scoring, not by retraining classifiers.

