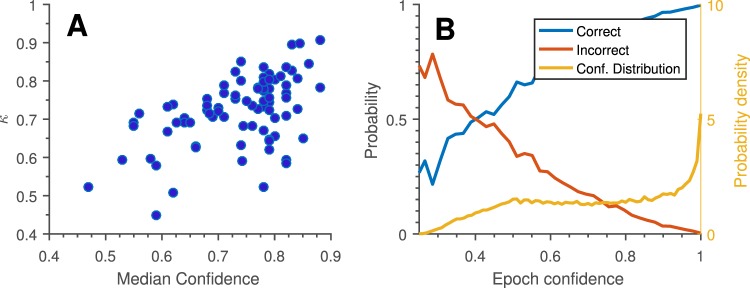
Figure 8.
Classifier performance versus classifier confidence: The automatic sleep scoring algorithm also estimates the probability of the chosen label being correct. This may be interpreted as our ‘confidence’ in the scoring. (A) Median confidence for all assigned labels across each night relative to Cohen’s kappa for the same night. We see a clear trend of greater confidence across a whole recording corresponding to greater overall scoring performance. (B) Observed probability of a given epoch being correctly/incorrectly labeled, as a function of label confidence (plotted to left axis). ‘Conf. Distribution’ shows the distribution of epoch-level confidence estimates (plotted to right axis). As in (A), we see a clear trend of high confidence epochs generally being correctly labelled. Given an epoch of specific confidence we see that confidence has to be below 0.4 for the label to be most likely incorrect, and that most confidence estimates are above 0.5. Both graphs are based on leave-one-subject-out cross validation for 5-stage scoring.

