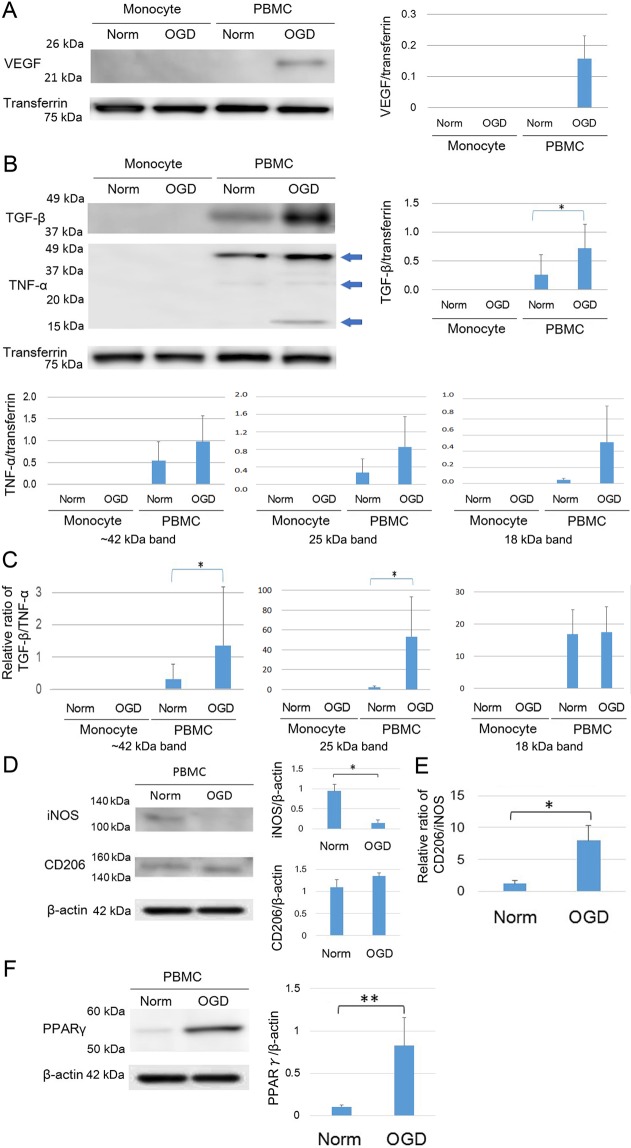
Figure 1.
Characteristics of rat primary-cultured peripheral blood mononuclear cells (PBMCs) preconditioned by oxygen-glucose deprivation (OGD) (OGD-PBMCs). The levels of the secretory vascular endothelial growth factor (VEGF) (N = 4) (A), anti-inflammatory cytokine transforming growth factor-β (TGF-β) and pro-inflammatory cytokine tumour necrosis factor-α (TNF-α) (N = 7 each) (B) from the conditioned media of rat primary-cultured PBMCs and isolated monocytes subjected to either normoxia (norm) or OGD. Western blotting for TNF-α showed a band around 42 kDa, a weak 25 kDa band and an 18 kDa band (arrow). (C) The ratio of TGF-β per TNF-α, which reflects the PBMCs polarisation, under both the normoxic and OGD conditions (N = 7 each). The increase in the ratio of TGF-β per TNF-α reveals the polarisation to the protective anti-inflammatory status under the OGD condition. (D) Representative figures indicate the expression of the pro-inflammatory marker (i.e., inducible nitric oxide synthase, iNOS) and the protective anti-inflammatory marker (cluster of differentiation 206, CD206) in the cell lysate from PBMCs under both the normoxic and the OGD conditions (N = 6 each). (E) The ratio of CD206 per iNOS, which reflects the PBMC polarisation under both the normoxic and OGD conditions (N = 6 each). The increase in the ratio of CD206 per iNOS reveals the polarisation of the protective anti-inflammatory status under the OGD condition. (F) Representative figures indicate the expression of the peroxisome proliferator-activated receptor γ (PPARγ) in the cell lysate from PBMCs under both the normoxic and the OGD conditions (N = 6 each). Transferrin and β−actin confirmed an equal loading of proteins. Data represent the relative optical densities of each sample compared to the loading control band by unpaired t-test. *P < 0.05. **P < 0.01.

