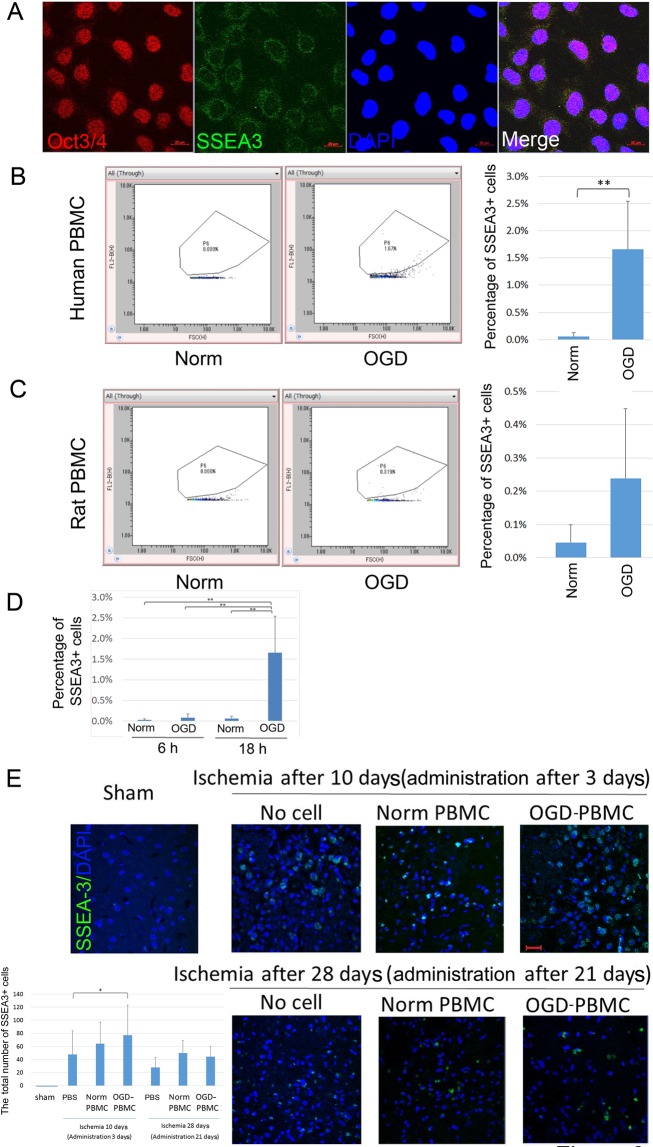
Figure 3.
Increasing number of SSEA-3-positive cells after OGD in vitro and the presence of SSEA-3-positive cells after OGD-PBMCs administration in vivo. (A) Representative figures of octamer-binding transcription factor 3/4 (Oct3/4) (red)/stage-specific embryonic antigen-3 (SSEA-3) (green)/DAPI (blue) triple labelling of NTERA-2 cells, as examined by confocal microscopy. Scale bars, 20 μm. (B, C) Expression of SSEA-3 using both the human (B) and rat (C) OGD-PBMCs by flow cytometric analyses. The x-axis represents forward scatter and y-axis represents the SSEA-3-FITC channel. SSEA-3-positive cells in the OGD-PBMCs were more prominent than those in the normoxic PBMCs by unpaired t-test. **P < 0.01. (each N = 6). (D) The two point time series of expression of SSEA-3-positive cells in the human OGD-PBMCs by flow cytometric analyses by two-way ANOVA. (each N = 6). (E) SSEA-3-positive cell recruitment in the sham-operated and ischemic cerebral cortices at days 10 (i.e., administration after 3 days) and 28 (i.e., administration after 21 days) after ischemia. A bar graph represents the total number of SSEA-3-positive cells. Statistical analyses were performed by one-way ANOVA. A secondary-only antibody control confirms its specificity. Scale bars, 20 μm. *P < 0.05. (N = 28).

