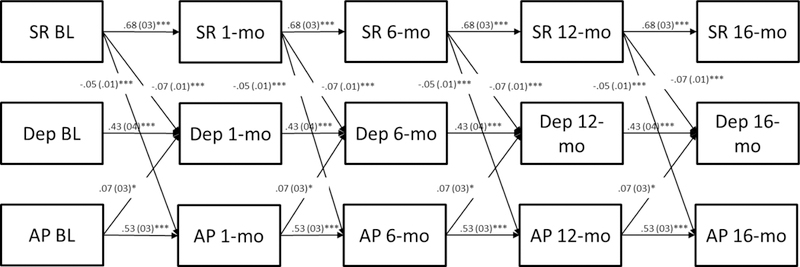
Figure 2.

Relationships between self-regulation (SR), depressive symptoms (Dep), and alcohol problems (AP) among college students (N = 393) measured at five timepoints (i.e., baseline, 1-month, 6-month, 12-month, and 16-month). Only significant relations are presented in this figure; full conceptual models can be found in the supplementary materials. Unstandardized beta estimates are reported in this figure. Autoregressive and cross-lagged relations were held constant across timepoints; contemporaneous relationships between variables were allowed to vary freely. Lower self-regulation, and higher alcohol problems and depressive symptoms, prospectively predicted higher depressive symptoms. Higher alcohol problems and lower self-regulation prospectively predicted higher alcohol problems. Only higher self-regulation prospectively predicted higher self-regulation. Lines represent significant cross-lagged or autoregressive relationships identified in the model. Contemporaneous relations were also significant but are not reported in this figure. *p < .05, ** p < .01, *** p < .001.
