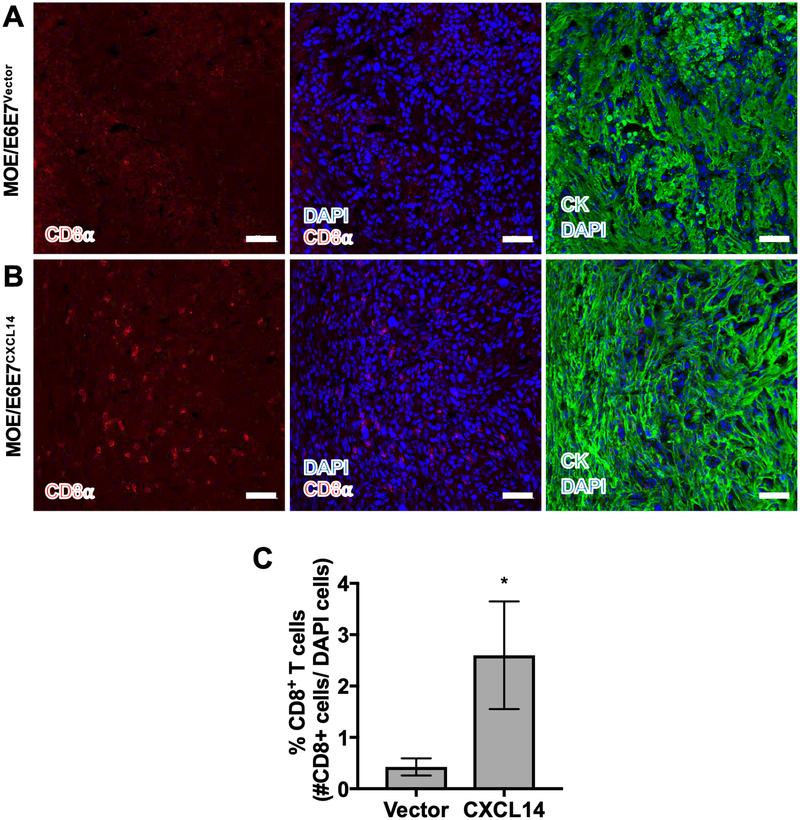
Figure 3. CXCL14 mediates CD8+ T cell infiltration into the tumor microenvironment.
Representative image of MOE/E6E7Vector (A) and MOE/E6E7CXCL14 (B) tumor sections immunostained with anti-CD8α antibody (red), anti-cytokeratin antibody (green) and DAPI (blue) to identify CD8+ T cells and tumor tissues. CD8+ T cells were quantified as a number of CD8α-positive cells per total number of DAPI-positive cells across 5 representative images (C). P values were calculated using Student’s t-test. *p < 0.05. Scale bars are 50 μm.

