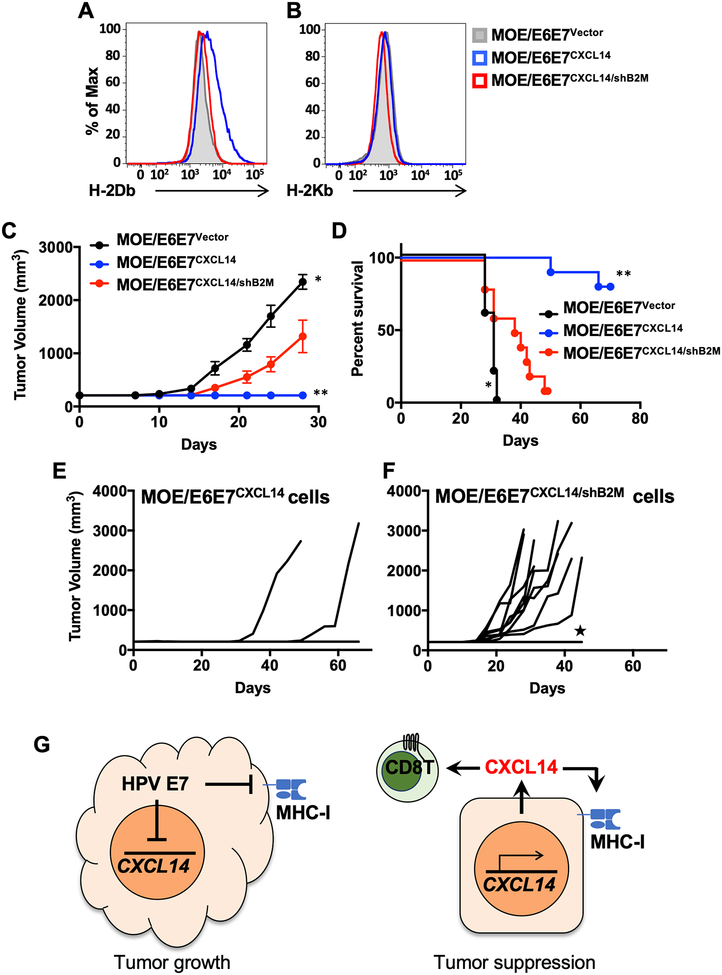
Figure 6. CXCL14-mediated tumor suppression is abrogated by MHC-I knockdown in HNC cells.
MOE/E6E7CXCL14 cells were transduced with shRNAs directed to B2M and enriched for knockdown by FACS sorting for the bottom 10% of MHC-I expressing cells (MOE/E6E7CXCL14/shB2M). Flow cytometric analysis of H-2Db (A) and H-2Kb (B) MHC-I molecules in MOE/E6E7Vector (gray), MOE/E6E7CXCL14 (blue), and MOE/E6E7CXCL14/shB2M (red) cells by flow cytometry. Wildtype B6 mice (n = 10 per group) were s.c. injected with MOE/E6E7Vector, MOE/E6E7CXCL14, or MOE/E6E7CXCL14/shB2M cells (5 × 10⁵ cells/mouse). Tumor volume was measured twice per week (C). Individual growth curves are shown from mice injected with MOE/E6E7CXCL14 (E) and MOE/E6E7CXCL14/shB2M (F) cells. Survival rates of mice injected with MOE/E6E7Vector, MOE/E6E7CXCL14, and MOE/E6E7CXCL14/shB2M cells were analyzed as was performed in Fig. 1 (D). Summary model of findings of CXCL14 on peripheral immune cells and on immune gene expression (G) P value of MOE/E6E7CXCL14/shB2M cells compared to MOE/E6E7Vector or MOE/E6E7CXCL14 cells was determined for tumor growth (C) and survival (D) by two-way ANOVA analysis. ★ represents mice that exhibited tumor growth but had to be euthanized due to self-inflicted wounds. *p < 0.01, **p < 0.001. Shown are representative of two independent experiments.

