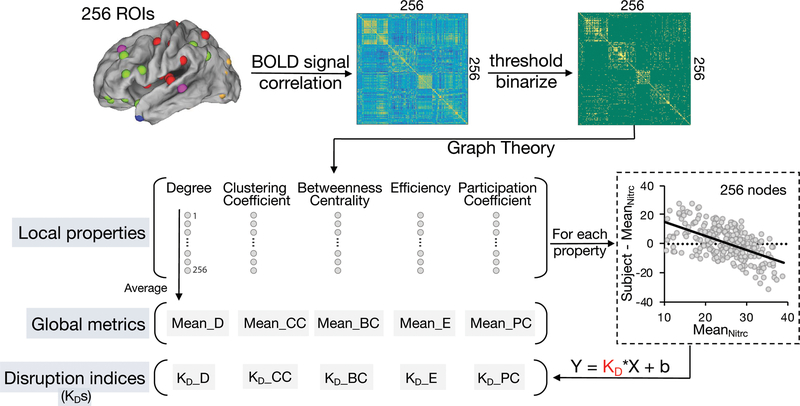
Figure 3. Calculation of graph local and global metrics and disruption indices.
For each subject in LDH-CP, LDH-HC, and off-site HC, 256 ROIs originated from 264 ROIs38 (excluded 8 ROIs located in cerebellum) were used to construct ROI-based functional networks. BOLD signal of each ROI was extracted as an average over voxels within 10 mm diameter spheres centered at peak coordinates. Following this, a 256 × 256 correlation matrix was generated, showing Pearson correlation coefficient between BOLD signals. Then under each of 9 given link density (from 2 to 10%), nodal-level (local) graph properties were respectively computed using the brain connectivity toolbox (BCT)42. Finally, the average of each property across 256 nodes produced their corresponding global graph metrics. Meanwhile, using the mean nodal-level graph properties across 272 subjects chosen in NITRC 1000 functional connectomes project as normative topological properties, for each subject in LDH-CP and LDH-HC, firstly degree (or other graph metrics) of each node was subtracted from the mean degree (or other graph metrics) of off-site HC (n = 272) of its corresponding node, at a pre-defined link density. Following this, the difference of degree (y axis) and its corresponding mean degree of off-site HC (x axis) was plotted across all 256 ROIs. Then KD was estimated as the slope of the fitted line. The details about calculating graph topological disruption index are expounded in 2.9.

