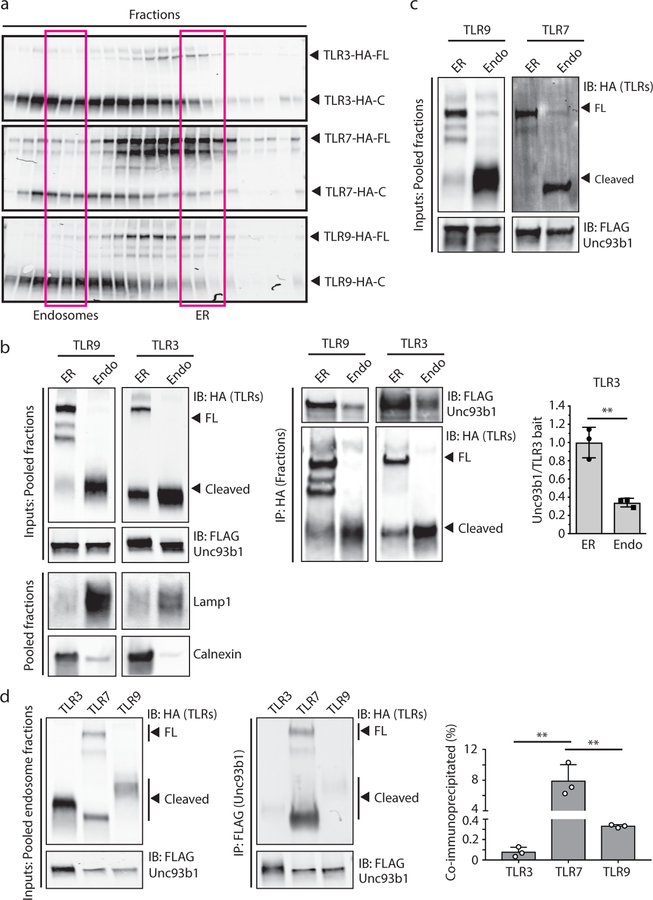
Extended Data Fig. 9: TLR3 but not TLR7 releases from Unc93b1 in endosomes.
(a) Subcellular fractionation of macrophages lines showing the distributions of TLR3, TLR7, and TLR9 across fractions. The pooled endosome and ER fractions for subsequent coimmunoprecipitations are highlighted. (b) Immunoprecipitation of TLR9- and TLR3-HA from pooled ER or endosome fractions of macrophage lines expressing wildtype Unc93b1. Immunoprecipitated TLR-HA levels were normalized across fractions and probed for levels of Unc93b1-Flag. Bar graph shows the quantification of Unc93b1 bound to TLR3 between ER and endosome fractions. Data are mean ± s.d., each dot represents data from an independent experiment (n=3). ** indicates p=0.0039 (paired two-tailed Student’s t-test). (c) Input controls of TLR9, TLR7 and Unc93b1 in pooled ER and endosome fractions (relates to Fig. 3d). (d) Less TLR3 or TLR9 is associated with Unc93b1WT in pooled endosome fractions compared to TLR7. Immunoprecipitation of Unc93b1-Flag from pooled endosome fractions (as shown in (a)) followed by immunoblot for TLR3-, TLR7-, or TLR9-HA. Bar graph shows the calculated relative proportion of Unc93b1-bound TLR compared to total amount of the same TLR in the pooled endosome fractions. Data represent the mean ± s.d., each dot represents data from an independent experiment (n=3). ** indicates p=0.0032 (TLR3 vs TLR7) and p=0.0036 (TLR7 vs TLR9), determined by unpaired two-tailed Student’s t-test. All immunoblots are representative of three independent experiments. FL: full-length.

