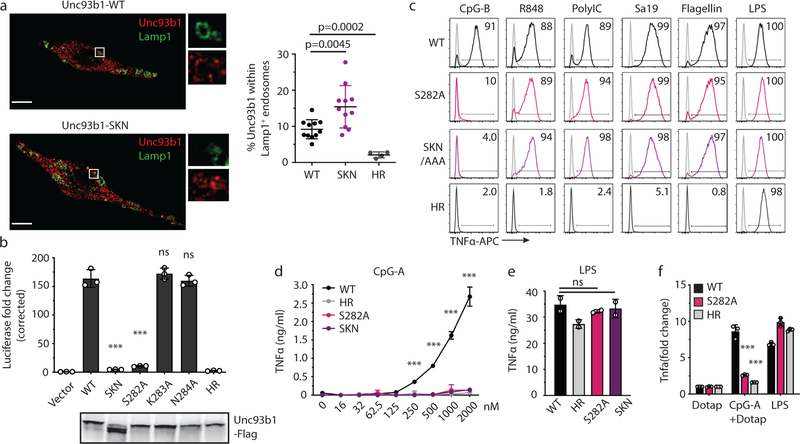
Extended Data Fig. 1: A luminal Unc93b1 mutation results in defective TLR9 signaling despite normal trafficking.
(a) Colocalization of Unc93b1 and Lamp1 in macrophages expressing the indicated Unc93b1 alleles using superresolution structured illumination microscopy. Shown are representative images: Unc93b1 (red) and Lamp1 (green). Boxed areas are magnified. The plot shows quantification of the percentage of total Unc93b1 within Lamp1+ endosomes. Each dot represents an individual cell. p values determined by unpaired two-tailed Student’s t-test. Data are from a single experiment. Scale bars: 10µm. (b) Unc93b1S282A is sufficient for the TLR9 signaling defect. NF-κB luciferase assay in HEK293T cells stimulated with CpG-B (1µM) for 16h. Data are normalized to Unc93b1-independent hIL-1b responses and expressed as luciferase fold change over unstimulated controls. n=3 biological replicates. *** indicates p<0.0001, ns = not significant (determined by unpaired two-tailed Student’s t-test). Blot below shows Unc93b1 expression levels. Representative of two independent experiments. (c) Intracellular cytokine staining of TNFα in macrophage lines expressing the indicated Unc93b1 alleles after stimulation with CpG-B (1 µM), R848 (100 ng/ml), PolyIC (100 ng/ml), Sa19 (200 ng/ml), Flagellin (100 ng/ml), and LPS (10 ng/ml). Gray histograms show unstimulated controls. Representative of two independent experiments. (d,e) TNFα production of the indicated macrophage lines after 8h stimulation with increasing concentrations of CpG-A (d), or LPS (50ng/ml) (e). n=2 biological replicates; *** indicates p<0.0001, ns = not significant, p values determined by two-way ANOVA followed by a Tukey’s posttest in (d) or by one-way ANOVA followed by a Tukey’s posttest in (e). Representative of two independent experiments. (f) Quantitative RT-PCR analysis of Tnfa expression in the indicated macrophage lines 8h after stimulation with CpG-A/DOTAP (1µM) or LPS (10ng/ml). n=3 biological replicates, *** indicates p=0.0003 for S282A vs WT) and p=0.0002 for HR vs WT, determined by unpaired two-tailed Student’s t-test. Representative experiment of two independent repeats. All data are shown as mean ± s.d.

