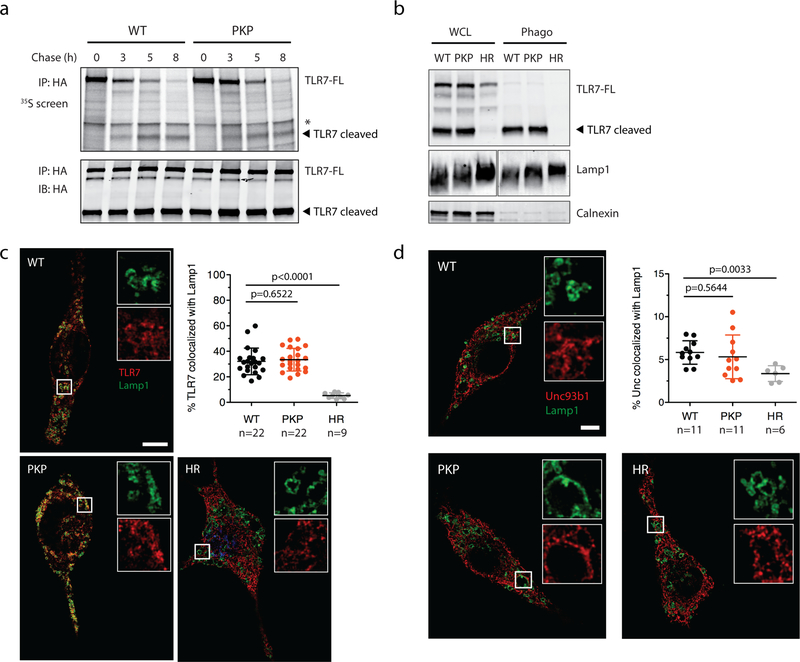
Extended Data Fig. 3: Unc93b1PKP does not alter TLR7 trafficking or localization.
(a) Unc93b1PKP does not alter TLR7 export rates. Pulse-chase analysis of TLR7 in Unc93b1WT and Unc93b1PKP-expressing RAW macrophages. Cell lysate was HA immunoprecipitated and subjected to radiolabeled screen and immunoblot. The full-length (FL) and cleaved forms of TLR7 are indicated. An asterisk denotes a nonspecific band. Representative of two independent experiments. (b) Unc93b1PKP does not affect TLR7 trafficking to endosomes. Levels of TLR7, Lamp1, and Calnexin in whole cell lysates (WCL) or lysates of purified phagosomes from the indicated RAW macrophage lines were measured by immunoblot. Representative of three independent experiments. (c) Colocalization of TLR7-HA and Lamp1 in RAW macrophages expressing the indicated Unc93b1-Flag alleles on a Myd88−/− background using superresolution structured illumination microscopy. Shown are representative Unc93b1WT, Unc93b1PKP and Unc93b1H412R cells: TLR7 (red) and Lamp1 (green). Boxed areas are magnified. The plot shows quantification of the percentage of total TLR7 within Lamp1+ endosomes with each dot representing an individual cell. Data are pooled from two independent experiments. Scale bars: 10 µm. Bars show mean ± s.d. (unpaired two-tailed Student’s t-test). P-values are indicated. (d) The subcellular localization of Unc93b1PKP is not altered relative to Unc93b1WT. Colocalization of Unc93b1-Flag (red) and Lamp1 (green) was measured using superresolution structured illumination microscopy in Unc93b1-deficient RAW macrophages complemented with Unc93b1WT, Unc93b1PKP, or Unc93b1H412R. A representative cell is shown for each Unc93b1 allele. Boxed areas are magnified. The plot shows quantification of the percentage of total Unc93b1 within Lamp1+ endosomes with each dot representing an individual cell. Data acquired in a single experiment. Scale bars: 10µm. Bars show mean ± s.d. (unpaired two-tailed Student’s t-test). P-values are indicated.

