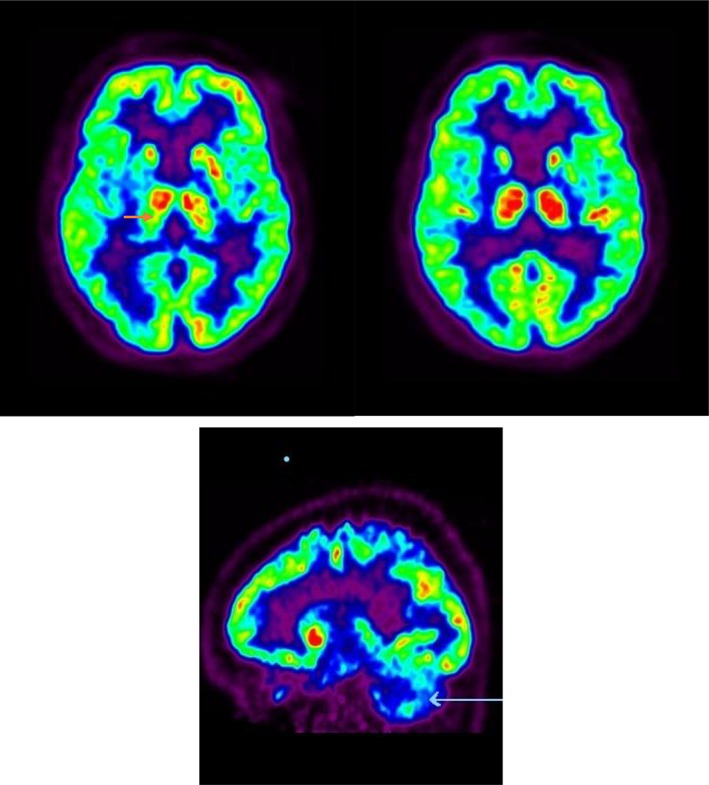
Figure 2.

18FDG PET scan of the brain shows moderate reduction in right putaminal uptake (orange arrow) with decreased activity in the left cerebellum (white arrow). No structural abnormality of the basal ganglia. The “light green” images are a comparison with the normal database; red = greater than normal; blue is >3 SDs below normal. SDs, standard deviations.
