
Fig. 2.
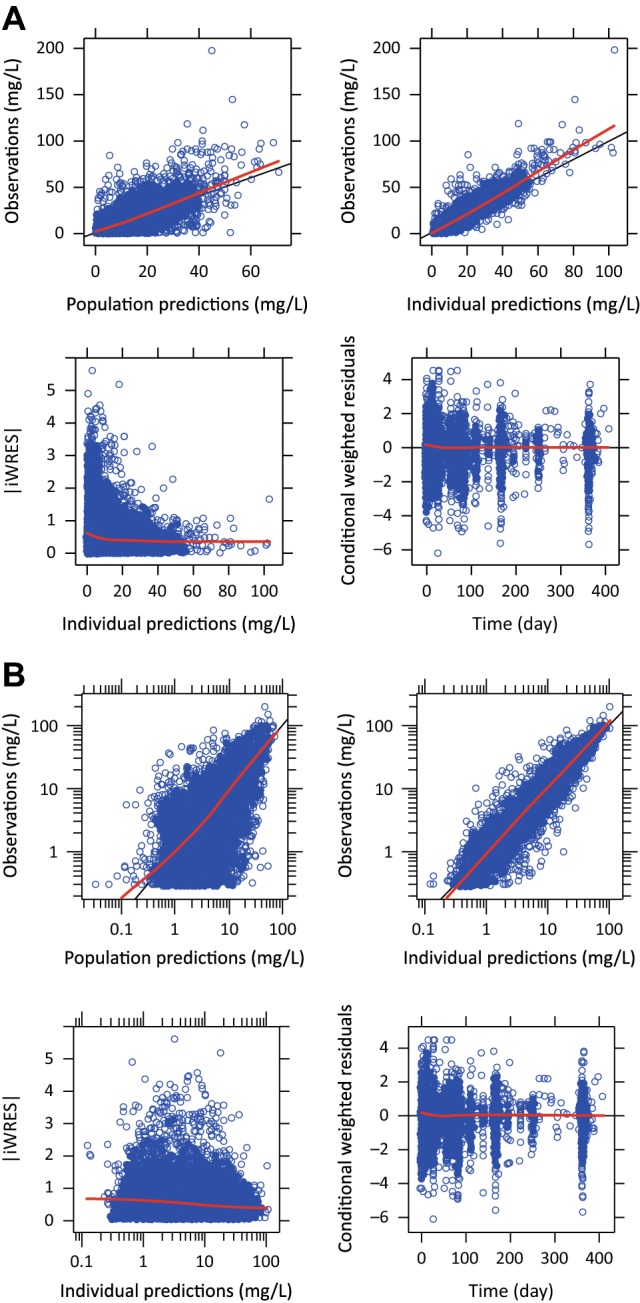
Basic goodness-of-fit plot with locally weighted scatterplot smoothing (LOWESS) [red lines] for the final model; solid black lines represent the line of unity. |iWRES| individual weighted residuals in linear scale (a) and log scale (b)
Official websites use .gov
A
.gov website belongs to an official
government organization in the United States.
Secure .gov websites use HTTPS
A lock (
) or https:// means you've safely
connected to the .gov website. Share sensitive
information only on official, secure websites.
Basic goodness-of-fit plot with locally weighted scatterplot smoothing (LOWESS) [red lines] for the final model; solid black lines represent the line of unity. |iWRES| individual weighted residuals in linear scale (a) and log scale (b)