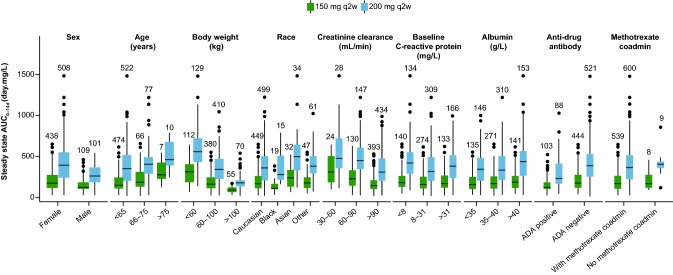
Fig. 5.
Box plot of sarilumab area under the plasma concentration–time curve from day 0 to day 14 (AUC0–14d) in patients with rheumatoid arthritis in phase III studies by covariates of general interest. The number above each box plot represents the number of patients in the corresponding group. ADA anti-drug antibody, coadmin, coadministration, q2w every 2 weeks

