Figure 5.
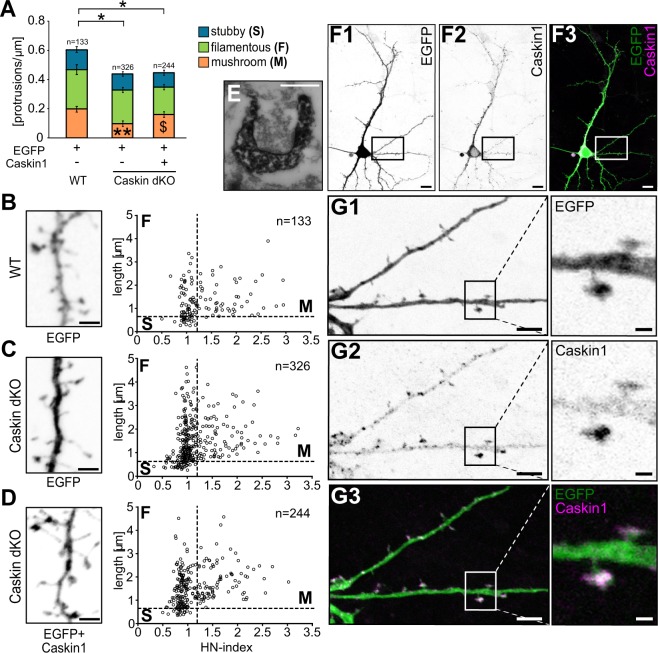
Caskin levels influence protrusion density and dendritic spine morphology in cultured hippocampal neurons. (A–D) Morphological characteristics of dendritic protrusions in EGFP-transfected C57Bl6/J (WT) neurons or Caskin dKO neurons overexpressing EGFP only or EGFP in combination with V5-tagged Caskin1. (A) Mean protrusion density on the tertiary dendritic branches, based on the morphological classification of protrusions as stubby, filamentous or mushroom24. Data were obtained from three independent cultures; the number of spines is indicated in the figures. All data are displayed as mean ± SEM. Asterisks represent significance compared to C57Bl6/J (WT) EGFP-expressing values and the $ symbol indicates significant differences between protrusion categories. *p < 0.05; **p < 0.01; $p < 0.05. (B–D) Dendritic protrusion morphology in EGFP-transfected C57Bl6/J WT neurons (B), Caskin dKO neurons overexpressing EGFP (C) and Caskin dKO neurons transfected with EGFP and V5-tagged Caskin1 constructs (D). Dots represent individual protrusions, plotted along the head/neck width ratio (HN-index) and length. Representative inverted fluorescent images of the EGFP signal are shown on the left side. Scale bar: 2 µm. (E) Electron microscopy detection of anti-V5 immunoreactivity by DAB precipitates in a dendritic spine of a CD1 neuron overexpressing V5-tagged Caskin1 protein. Scale bar: 200 nm. (F–G) Inverted fluorescent and merged images of a CD1 hippocampal neuron, expressing EGFP and V5-tagged Caskin1. Boxed areas on (F,G) designate the enlarged ROIs on (G). Scale bars indicate 10 µm (F1-3), 5 µm (left figures in G1-3) or 1 µm (enlarged ROIs on the right in G1-3).

